- Apr 29, 2024
Heatmaps
- Chaomei Chen
- 0 comments
Heatmaps are also known as 2-dimensional histograms. It is easy to spot a high-density area. It is relatively easy to understand. Here are some examples to illustrate typical patterns.
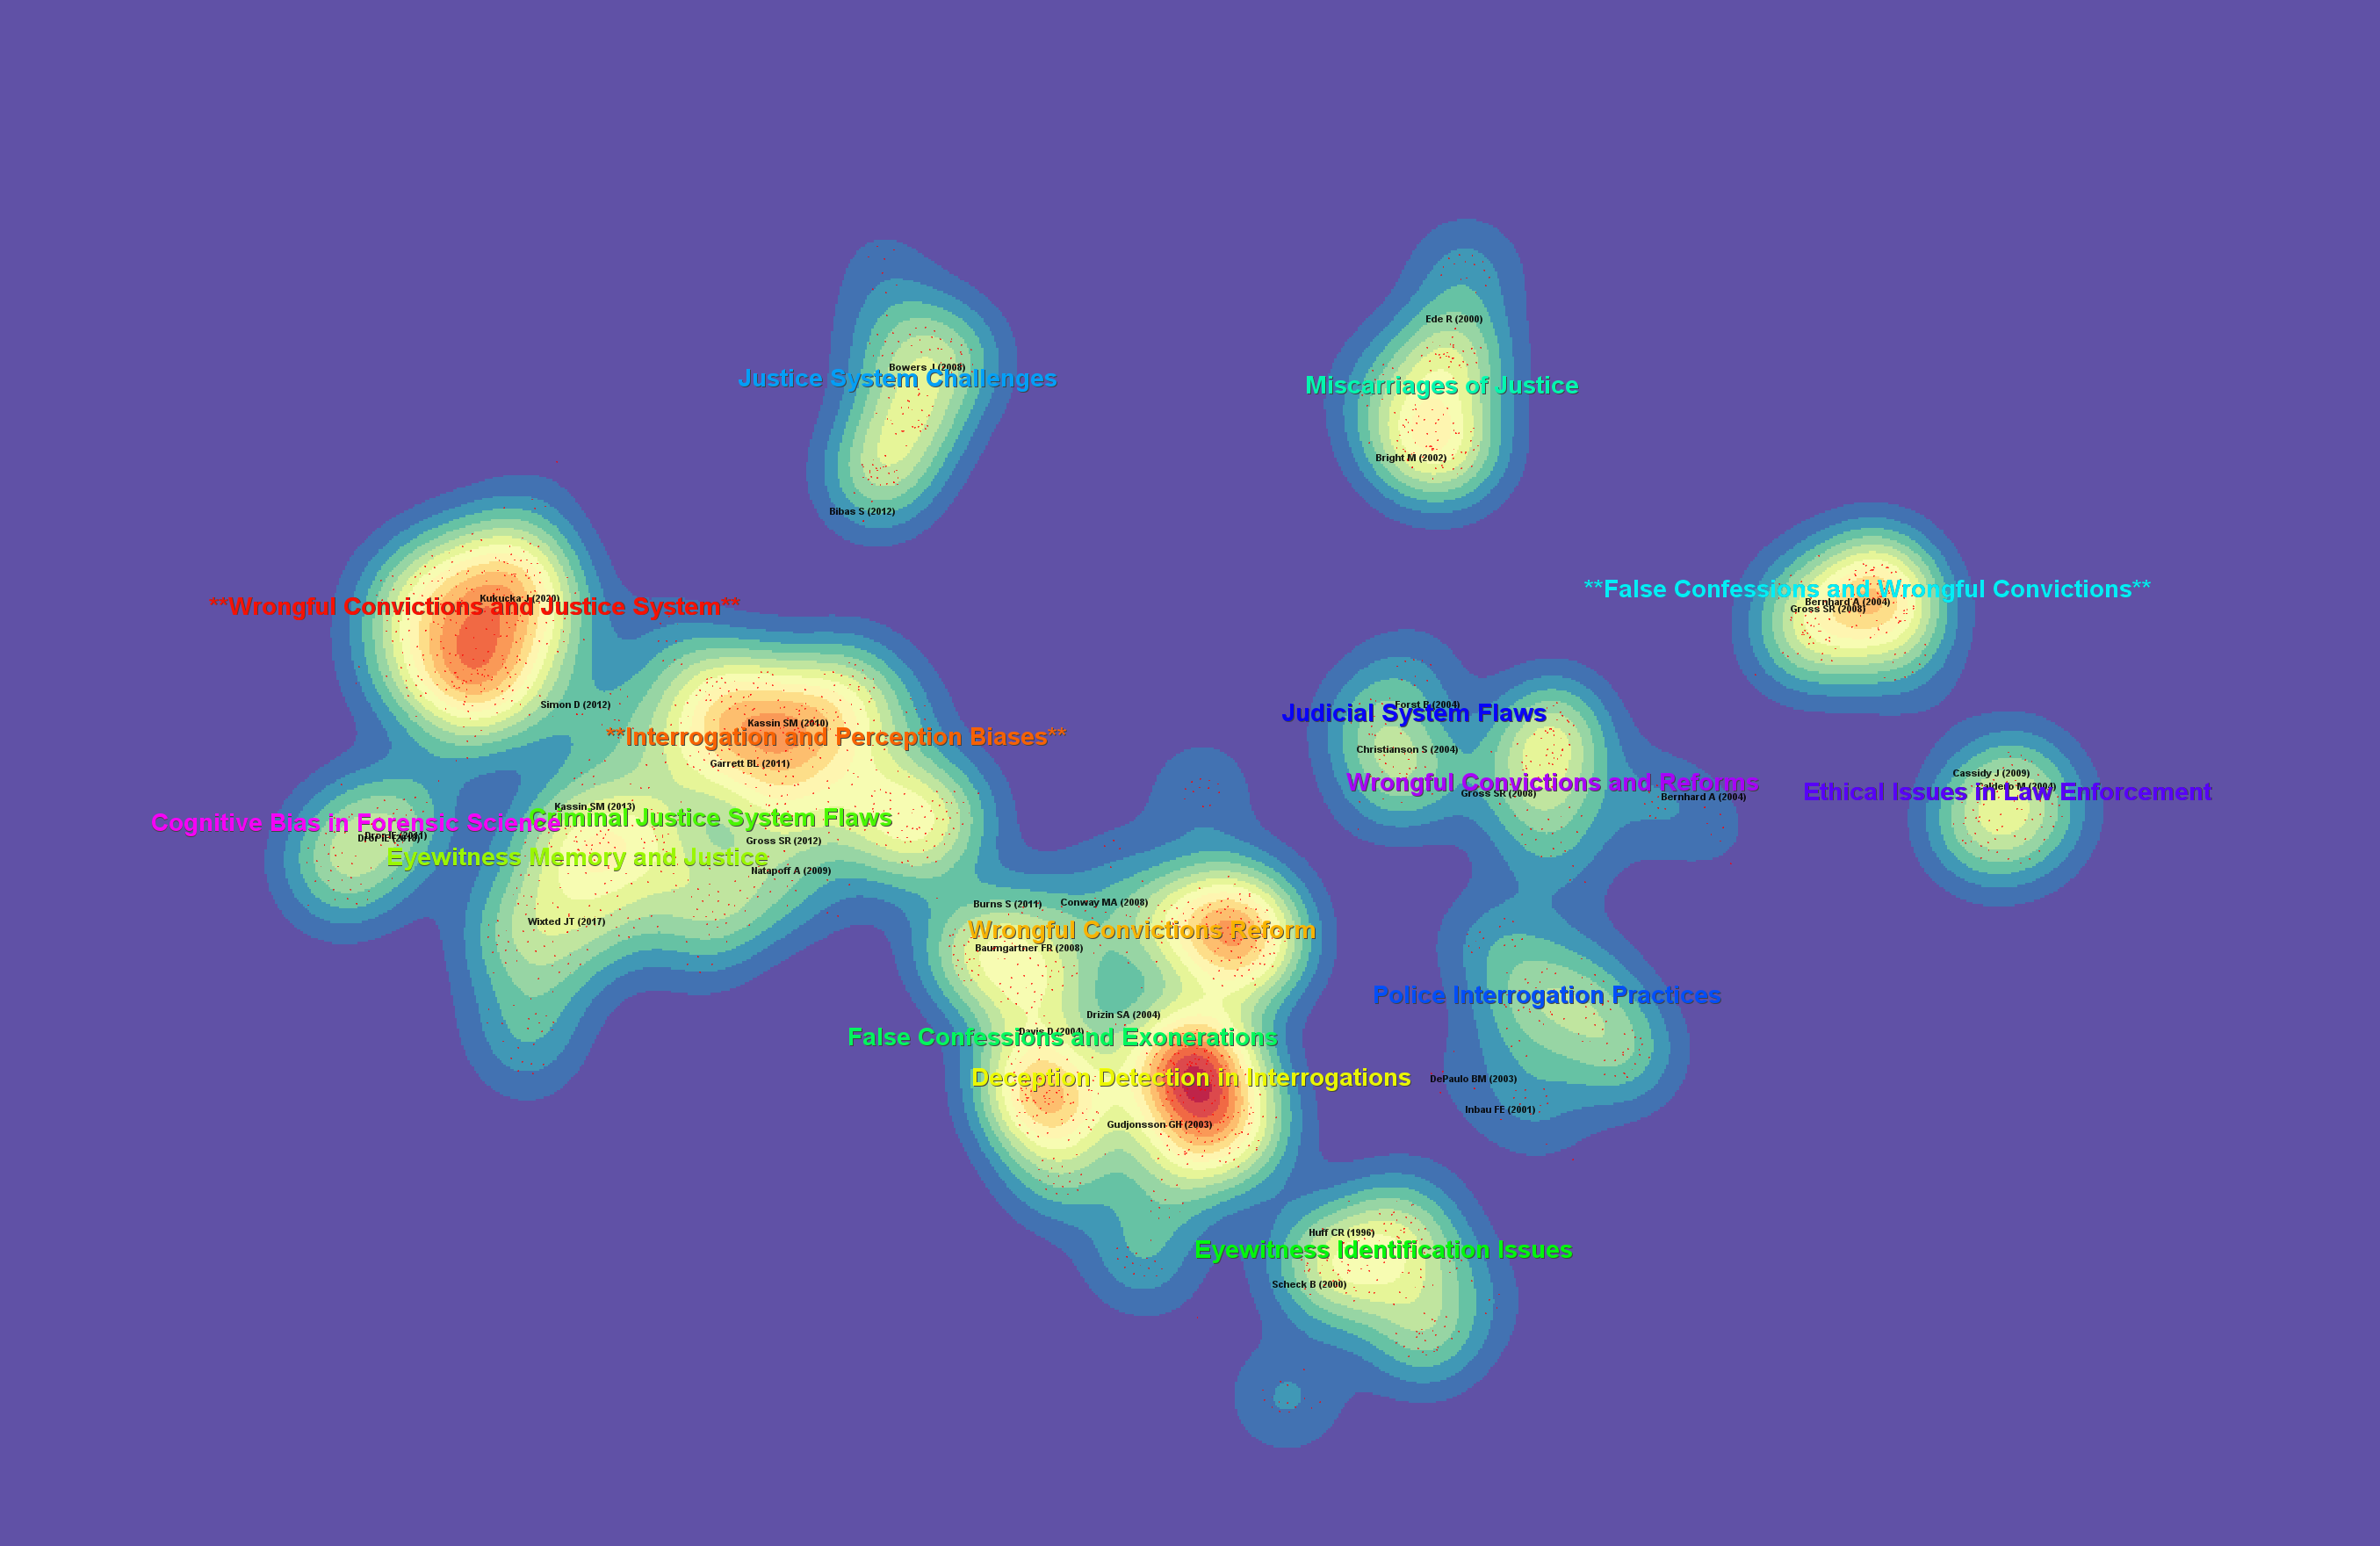
Preattentiveness is a useful concept in this context, which means a visual feature that is so distinct from its surroundings that one can capture it without even particularly paying any attention. Yes, just by glancing at the image below, our attention is effortlessly drawn to the high density area in red.
Heatmap by density in a rainbow colormap.
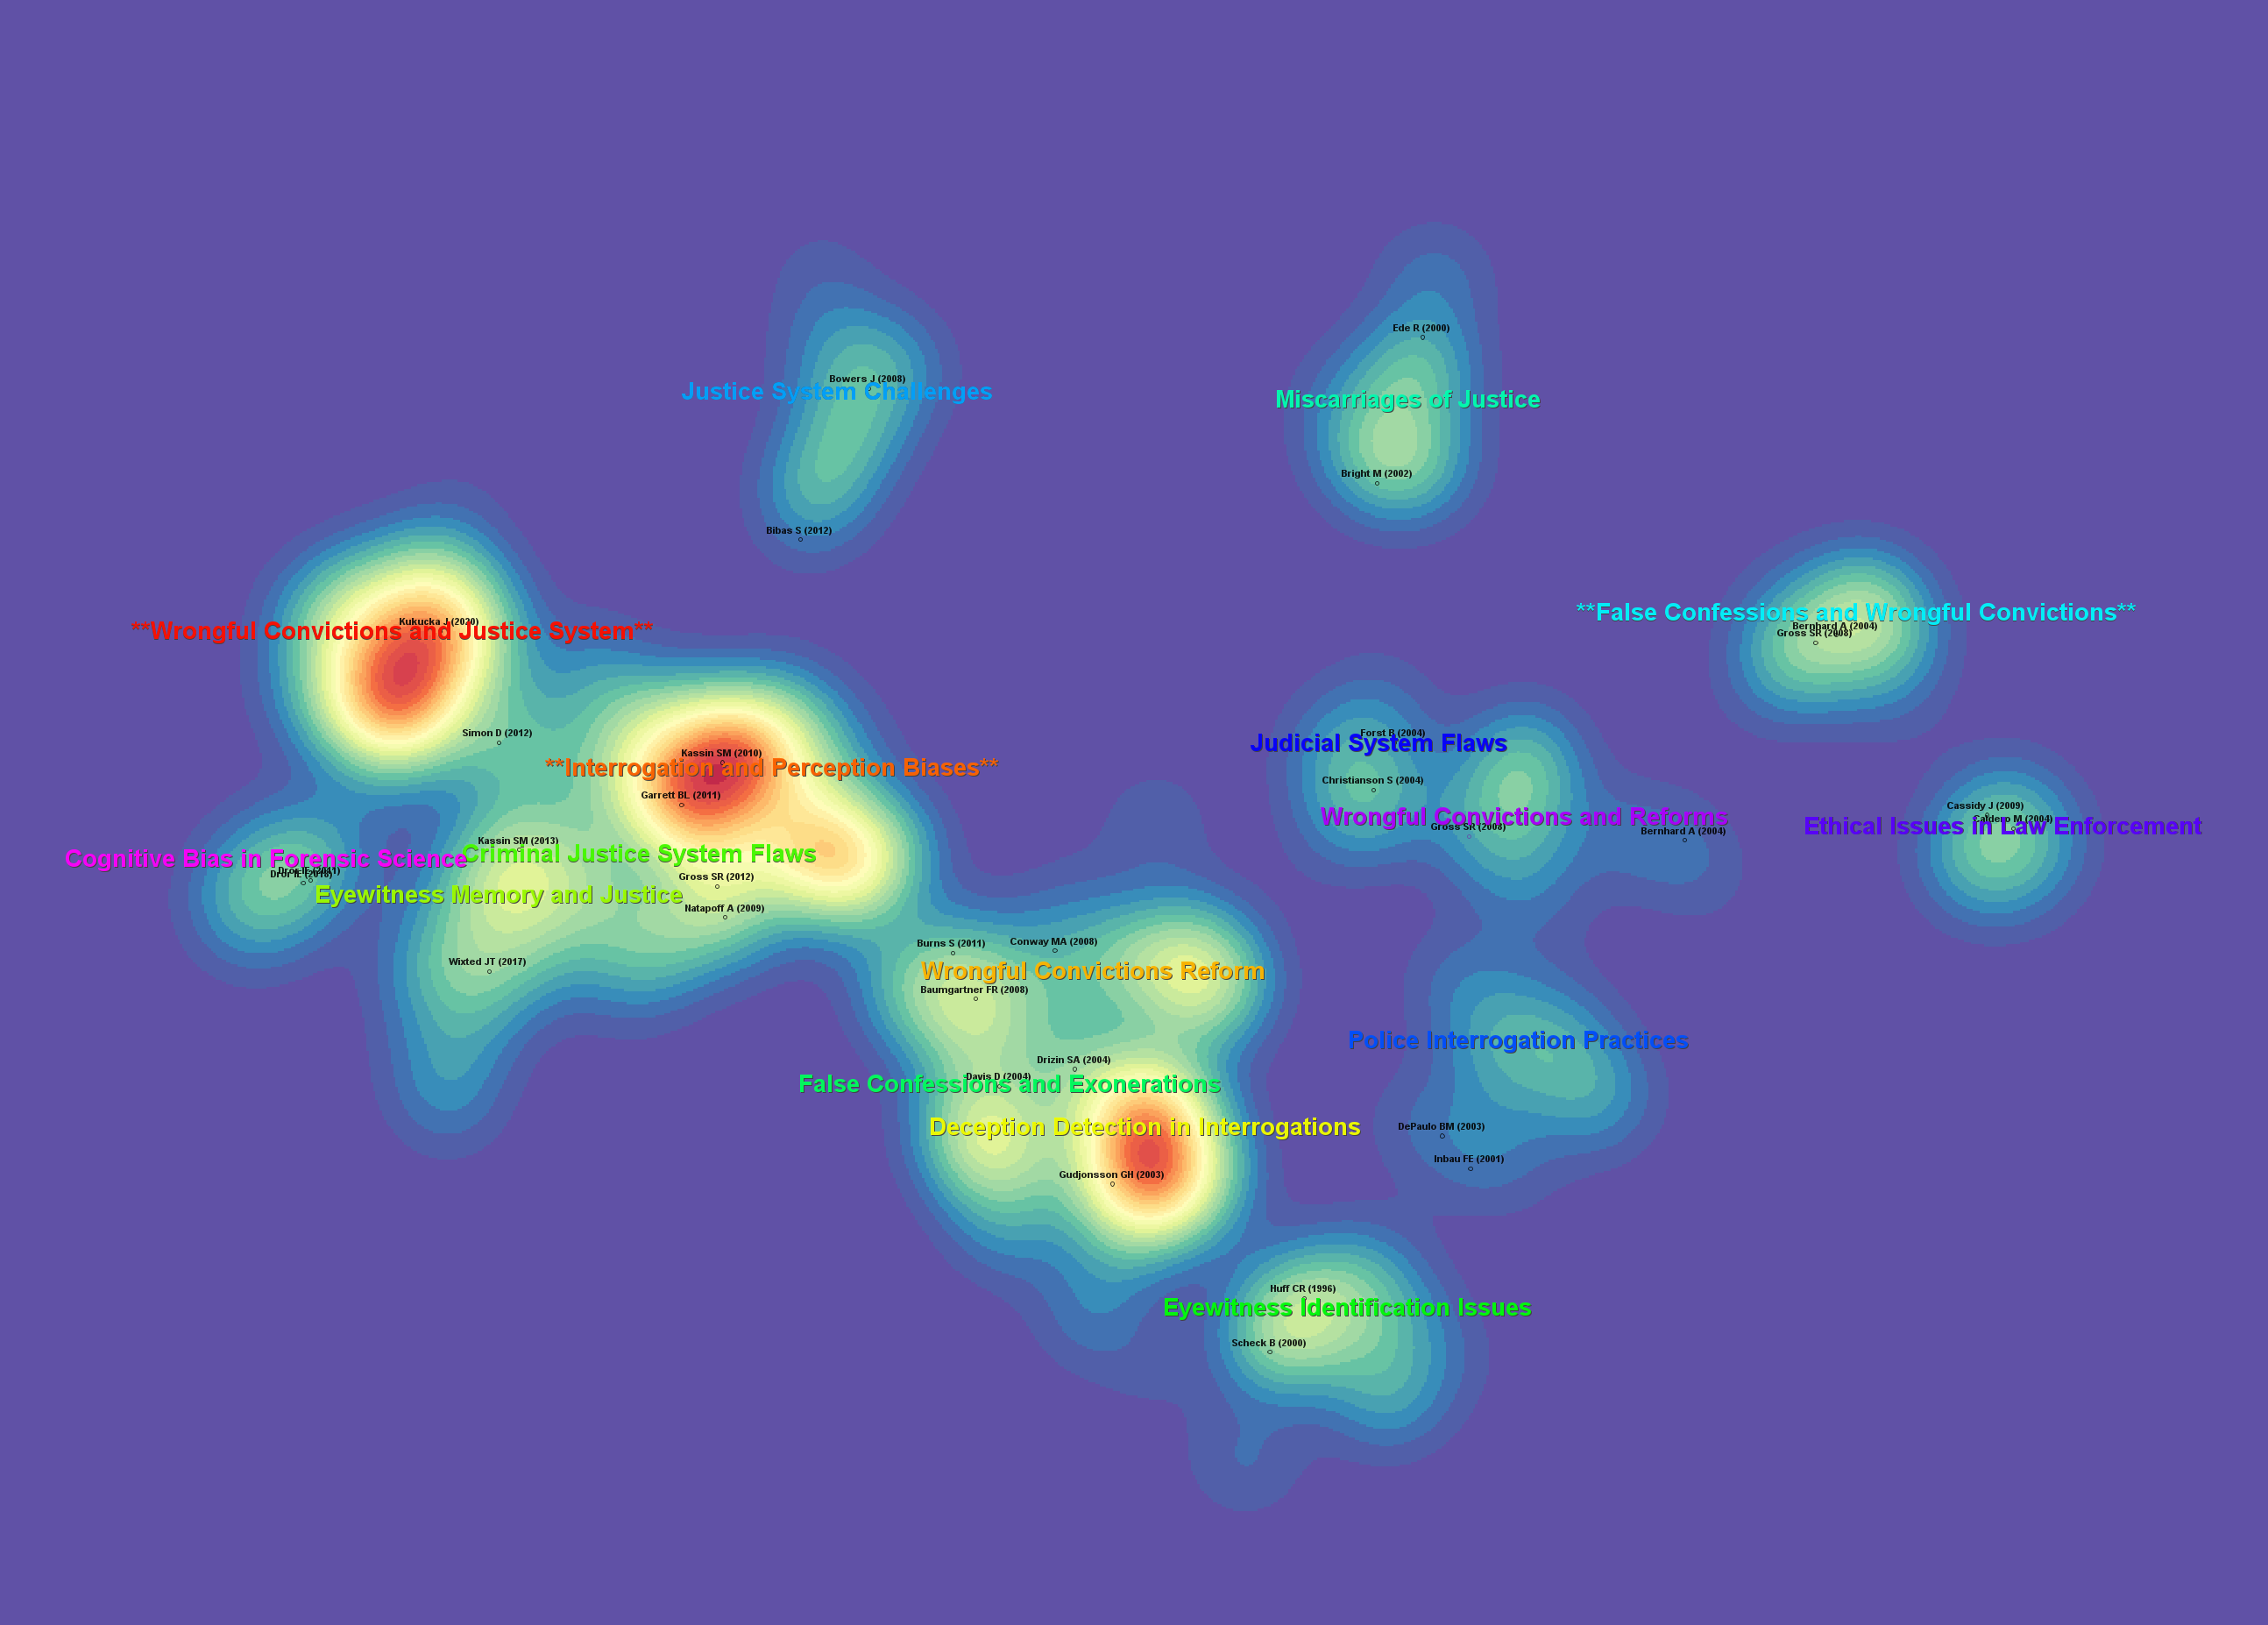
Obviously, different ways to measure the density will lead to maps with different areas heated. The following is based on the total number of citations received by the underlying publications. Citation-based heats are shifted to the two areas on the left. The once hottest area in the middle is no longer the hottest according to the different measure of the heat.
Heatmap by citation in a rainbow colormap.
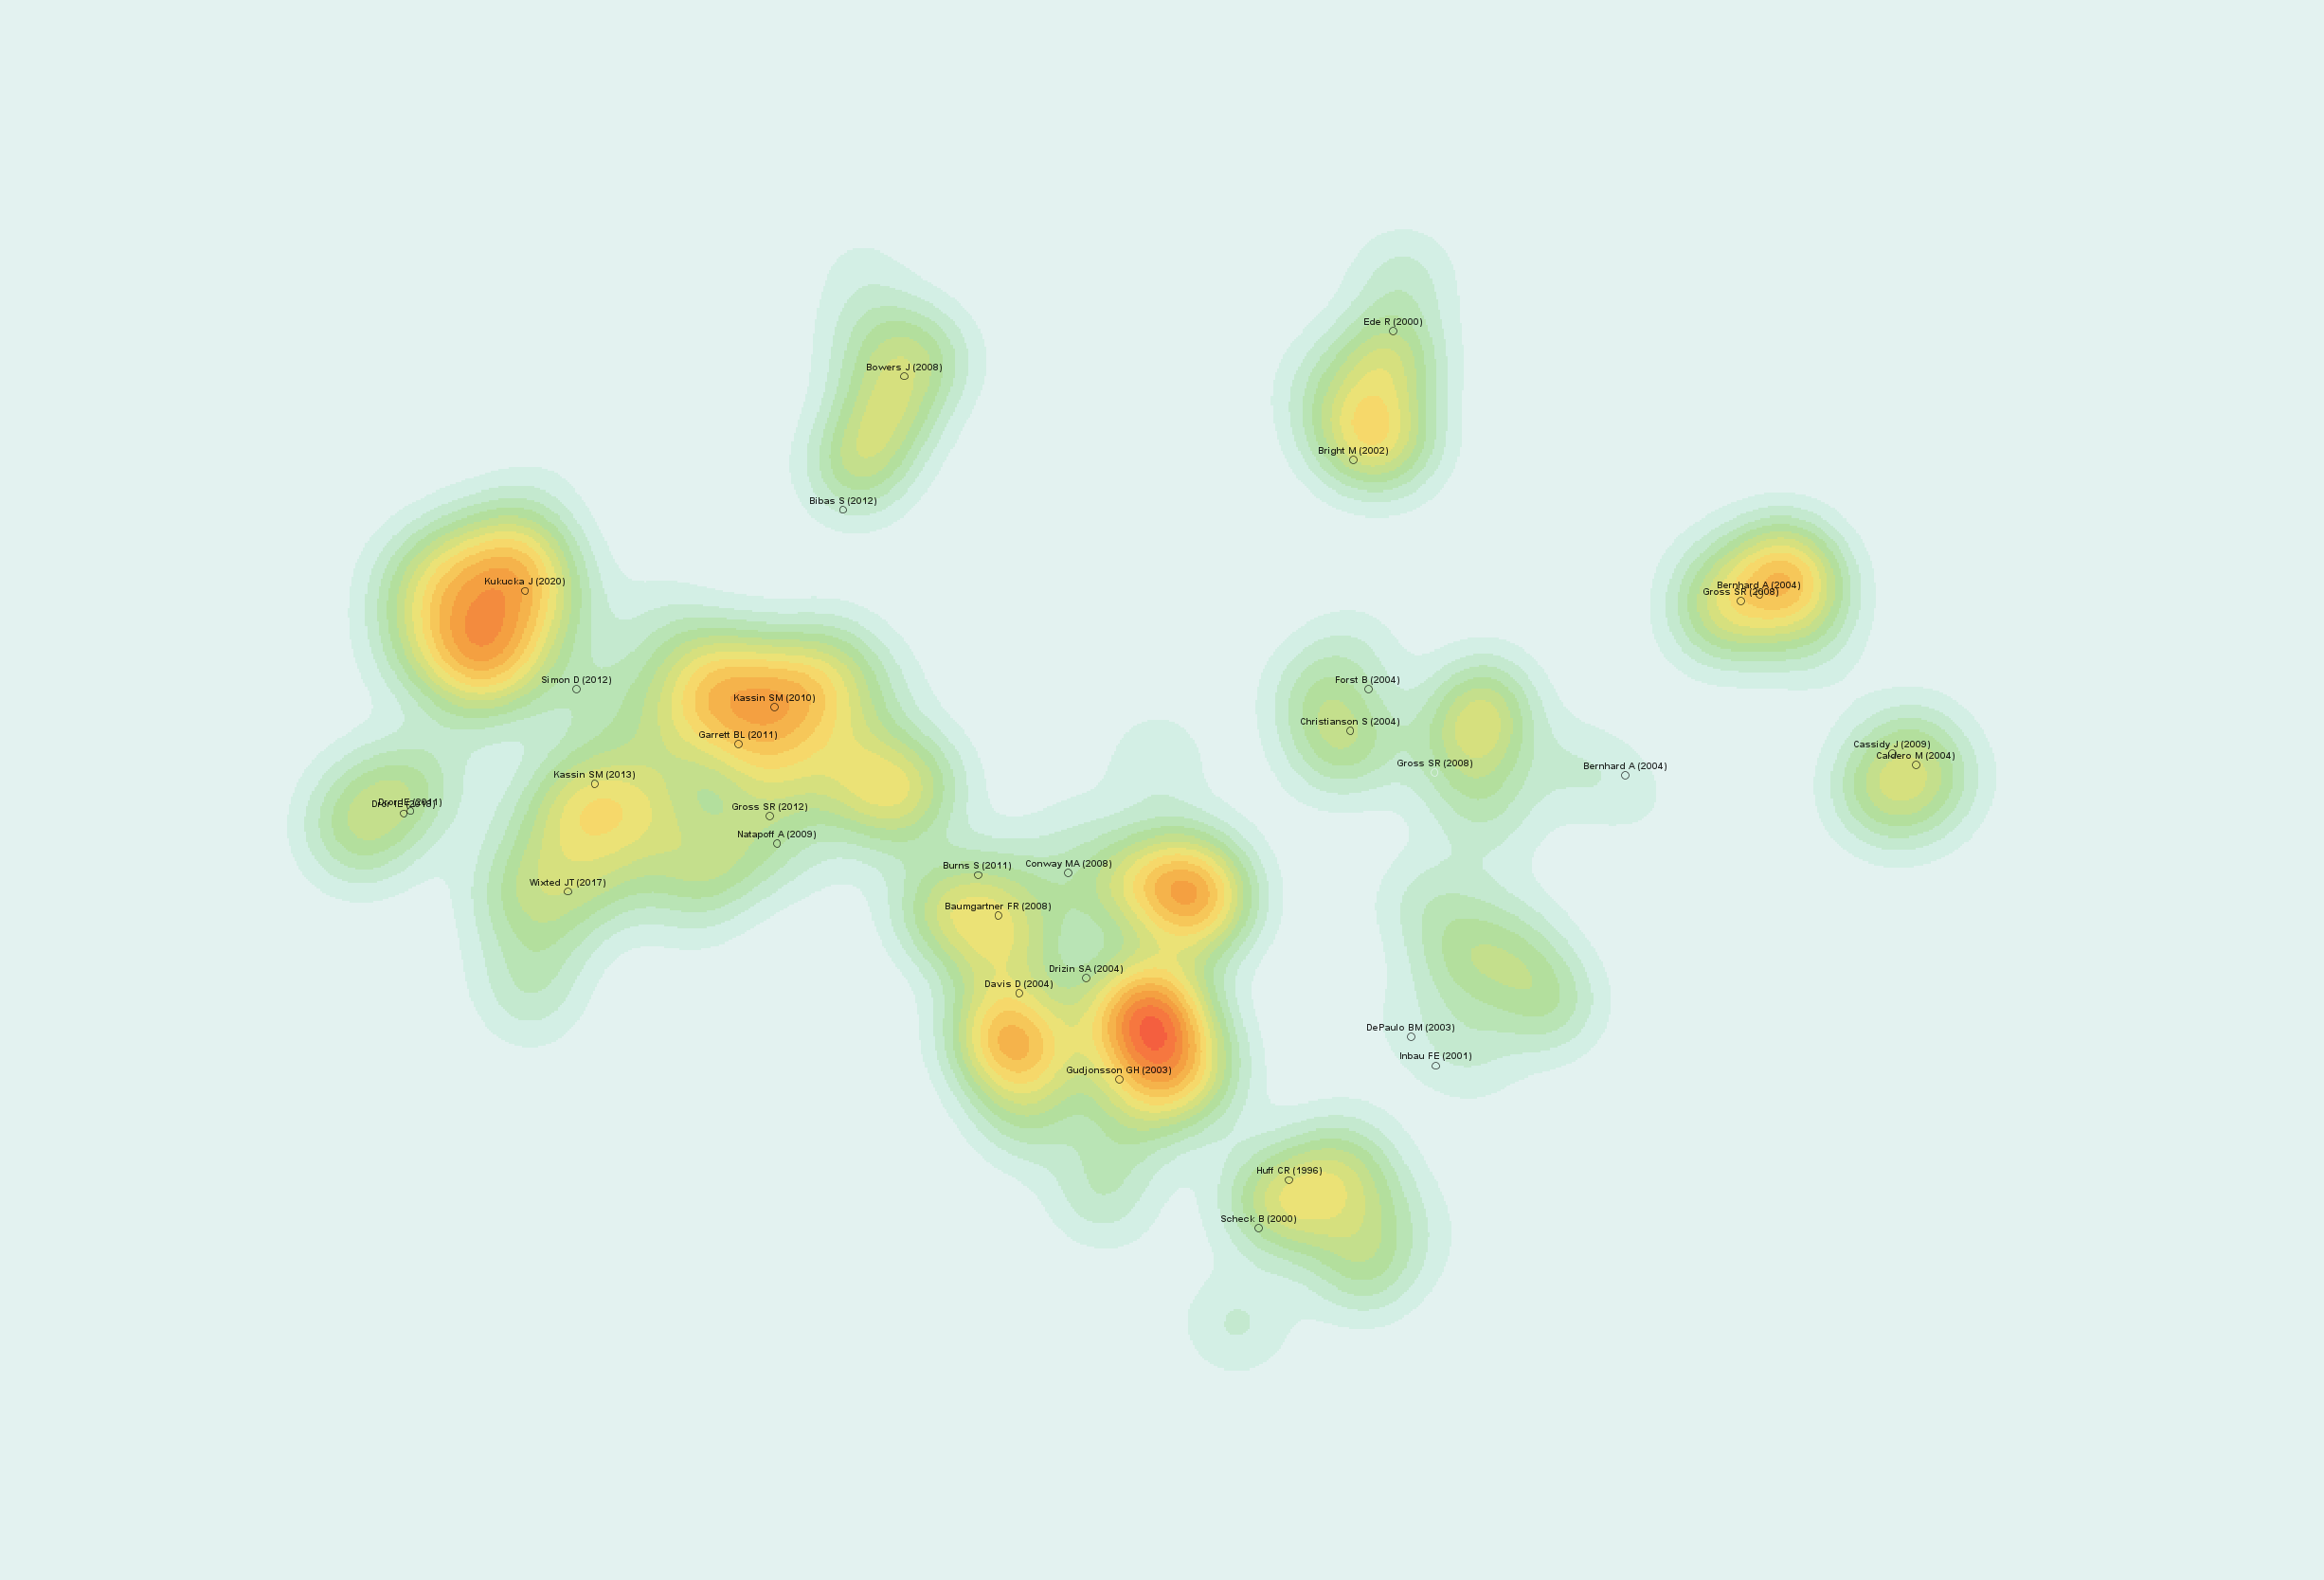
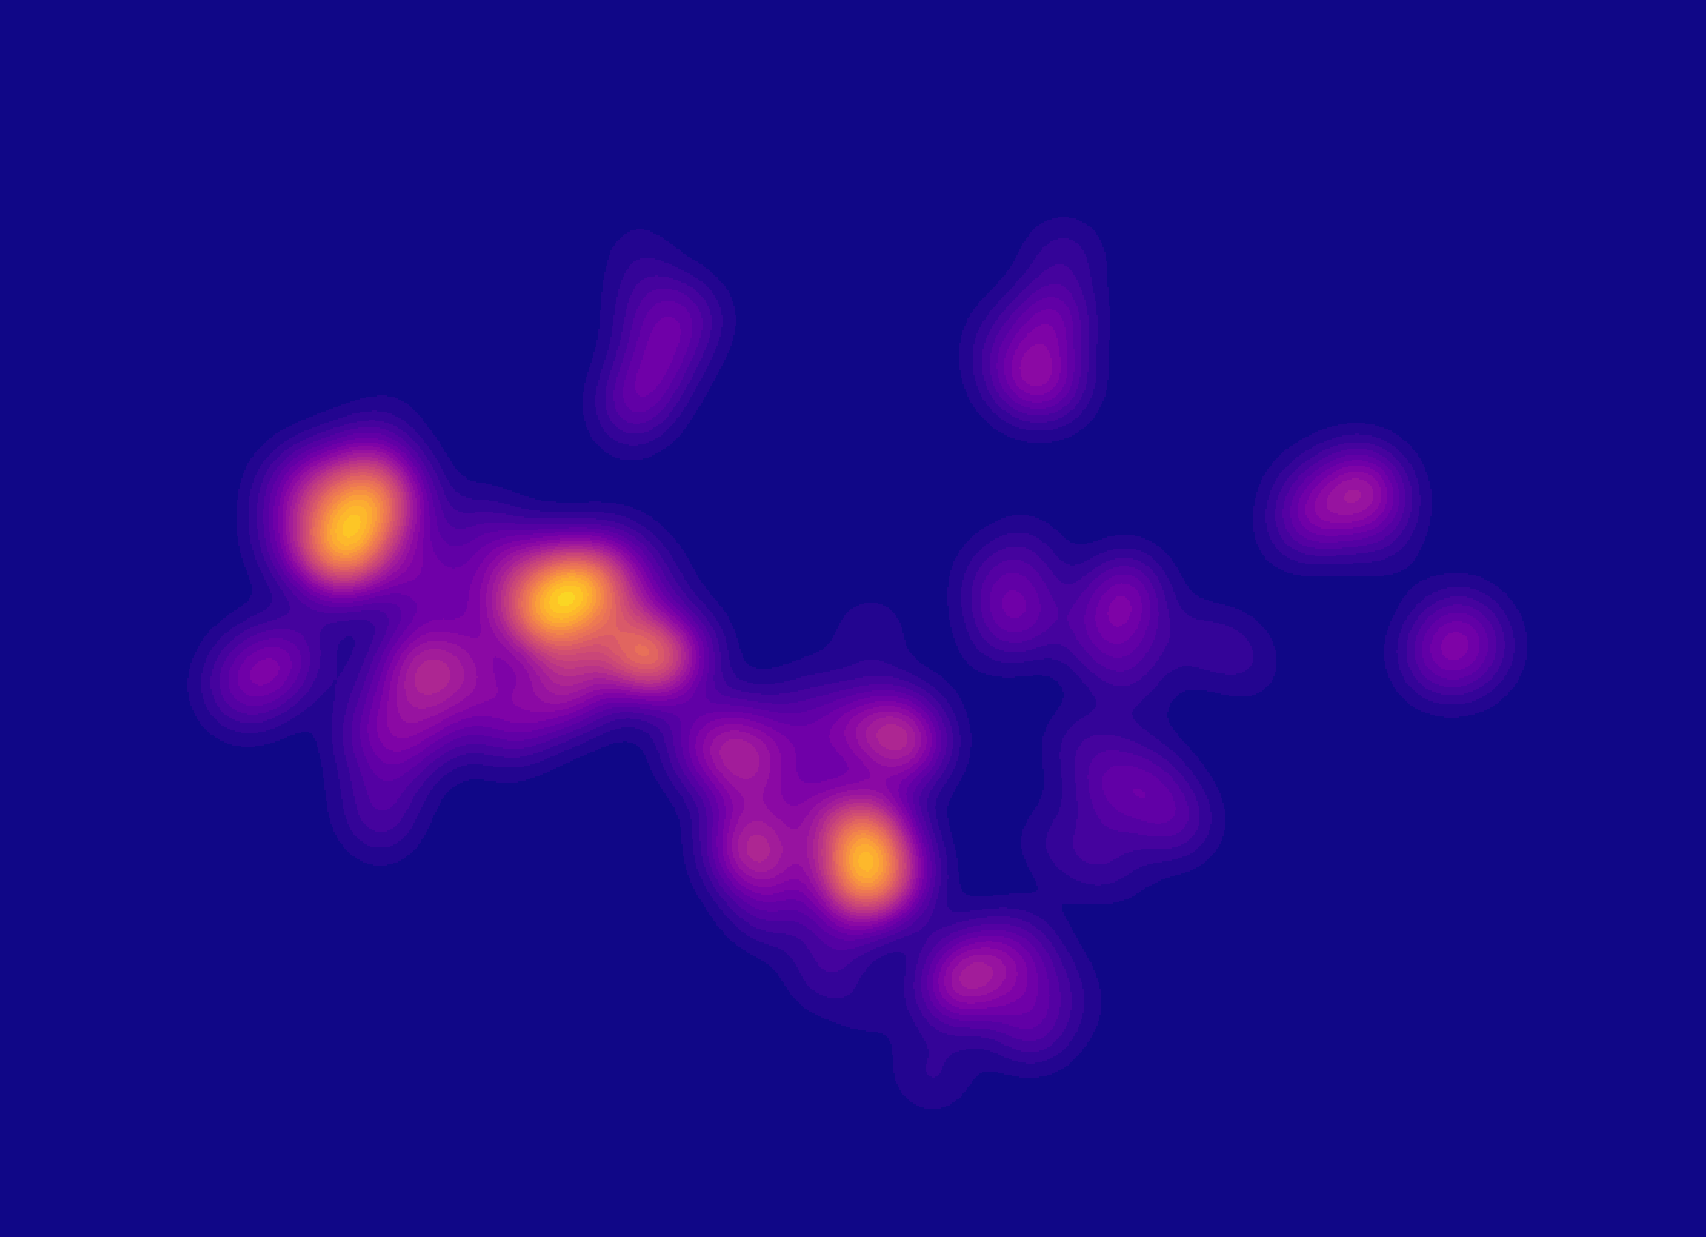
Examples below illustrate heatmaps generated with different colormaps, i.e., how various values are mapped to colors. Some colormaps are known for perceptually uniformed, whereas others are not. Depending on what you would like to do with the heatmaps, they may provide you with valuable insights.
Default
Plasma
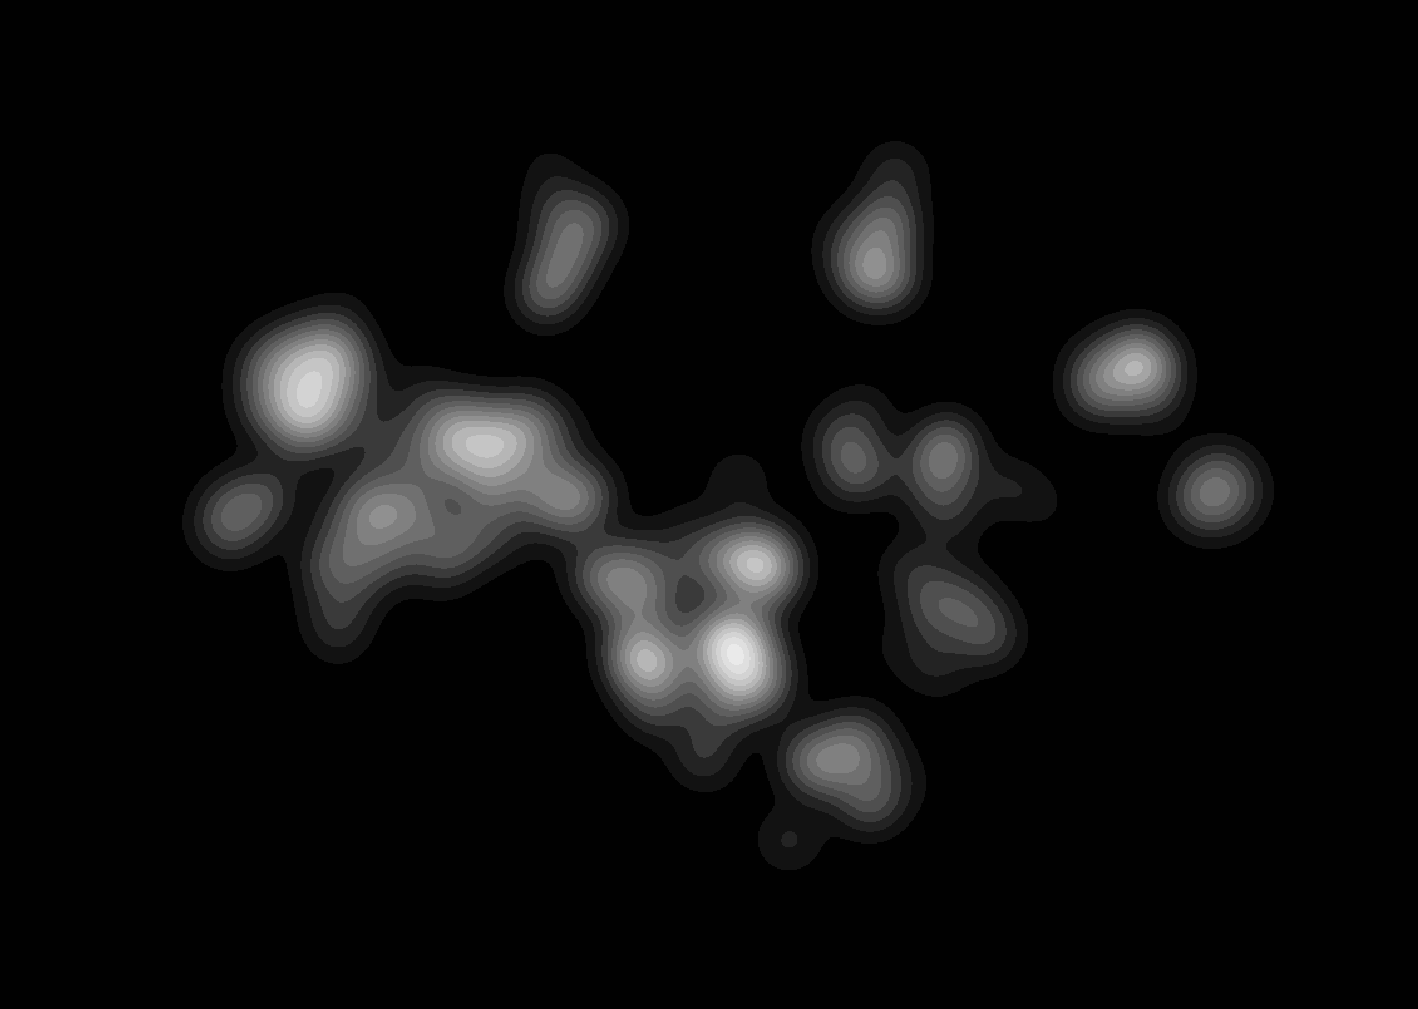
Greysacle
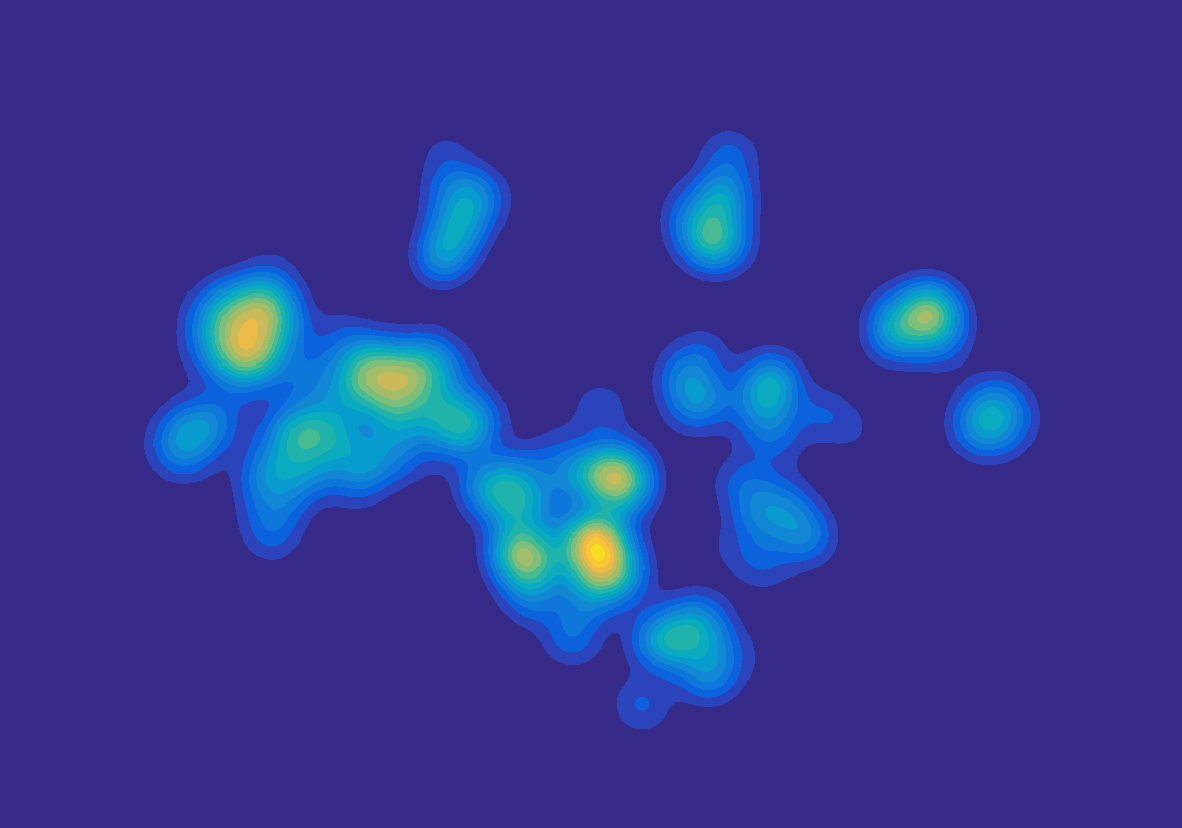
Blue-Green-Yellow
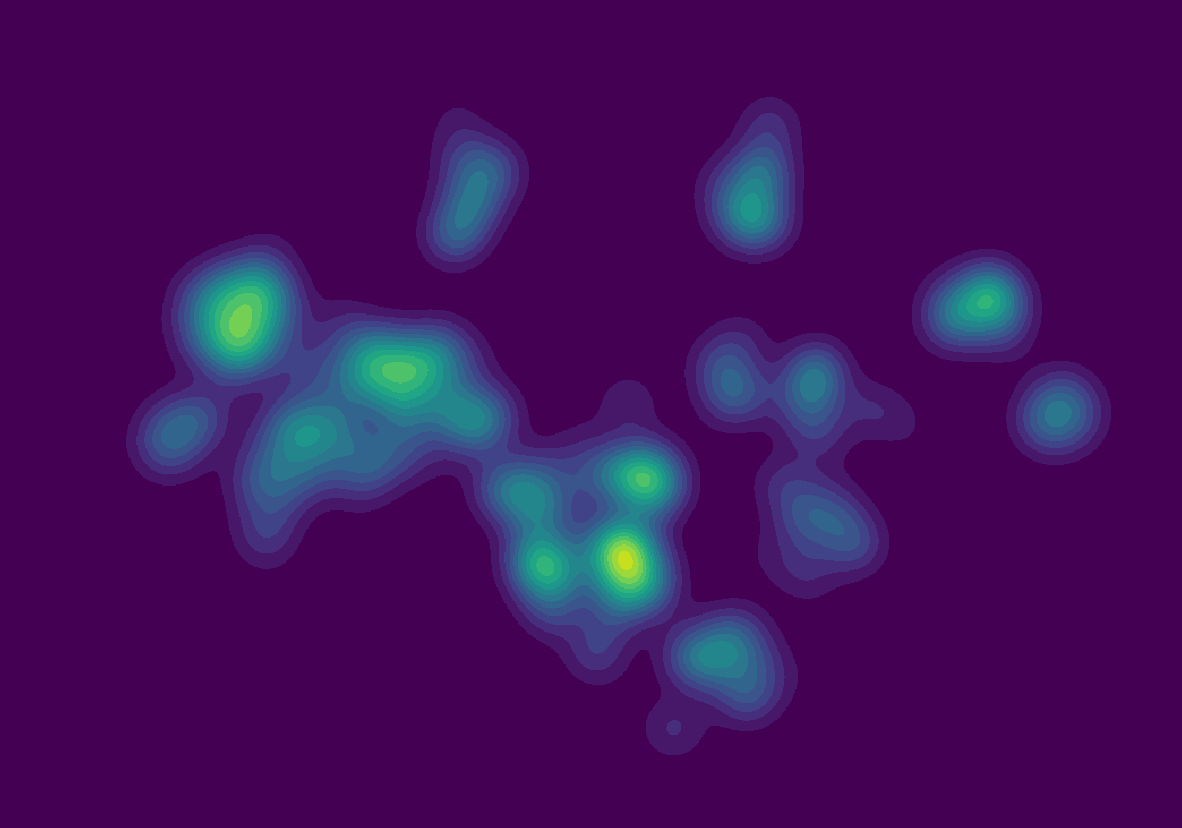
Viridis
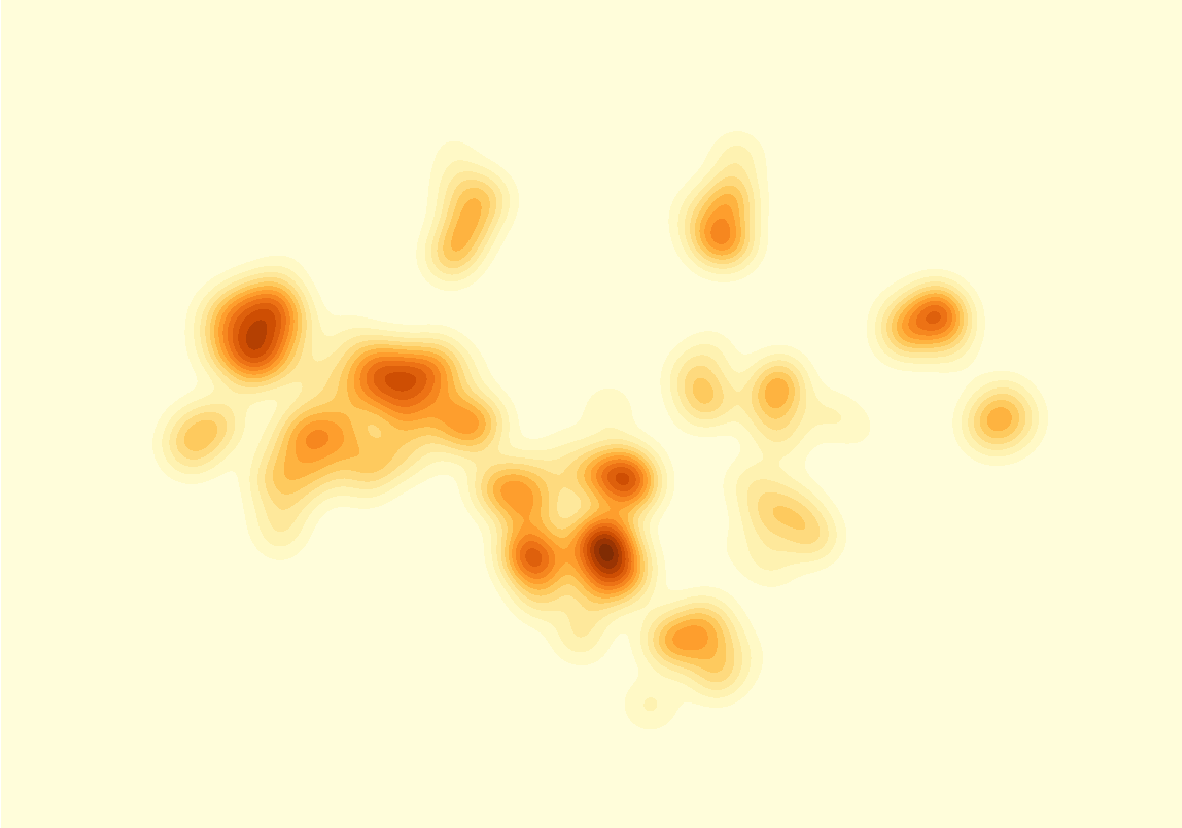
Yellow-Red
These features will be included in the next release of CiteSpace very soon. If you have questions or comments, please leave your comments.