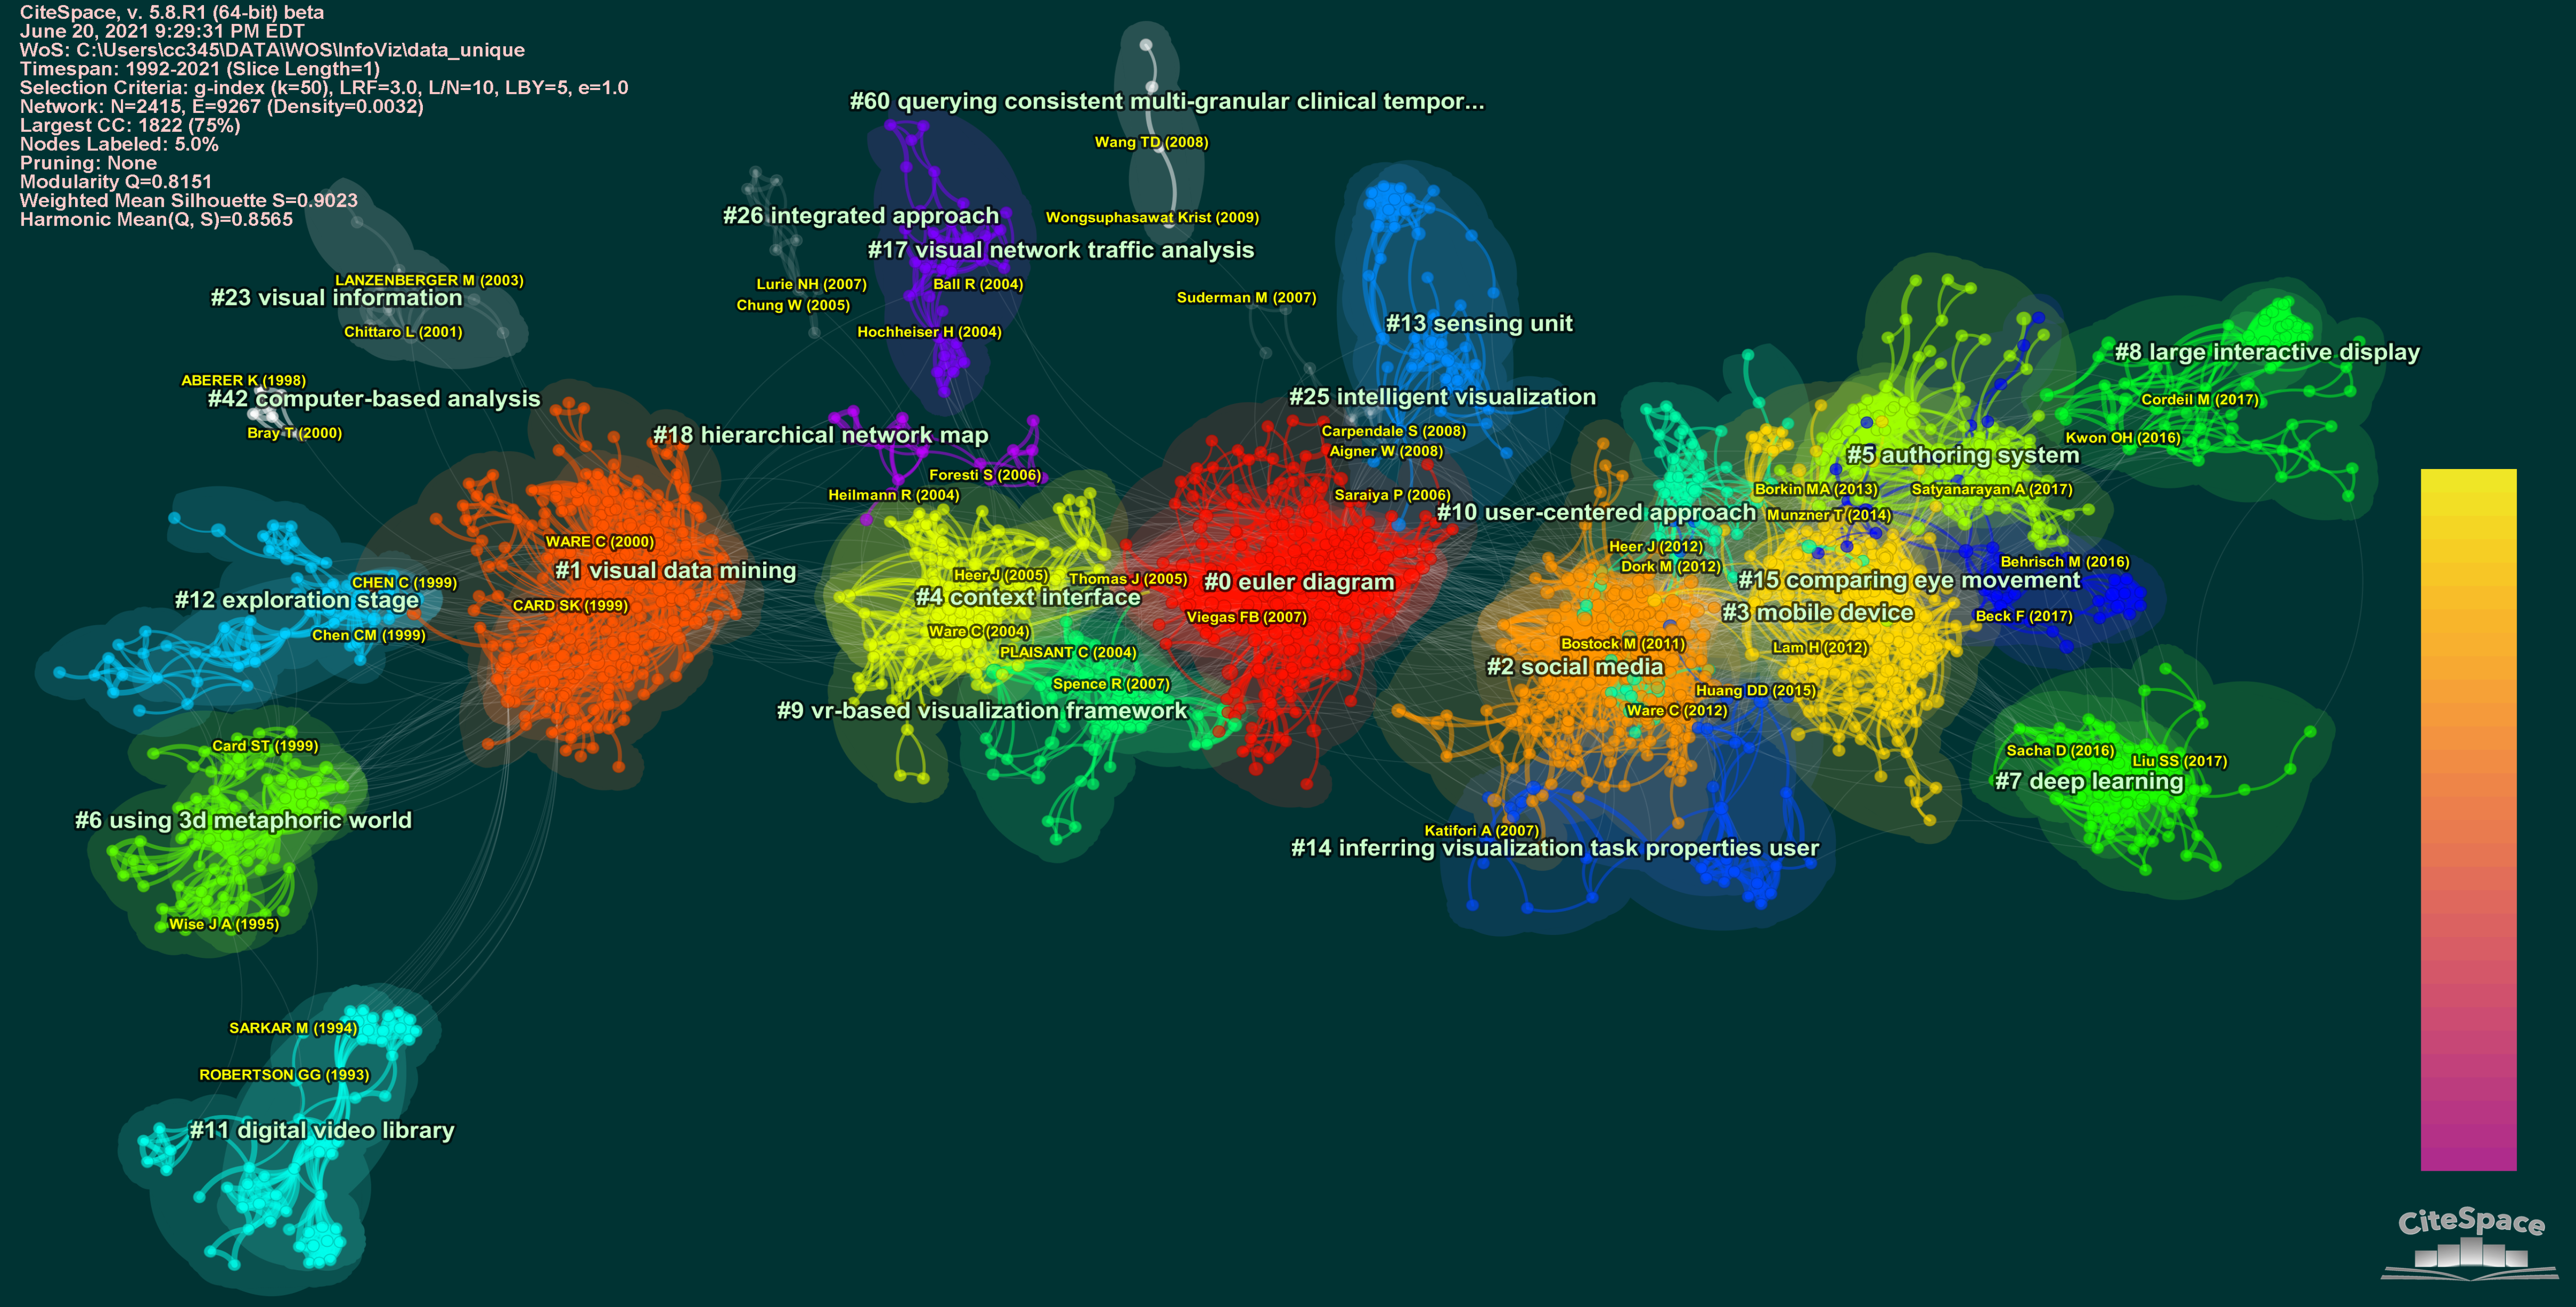
The largest connected component containing 30,209 nodes of a hybrid network of 92,200 cited references and terms. The largest 5 clusters were summarized by LLMs.

The same network in a further optimized layout.

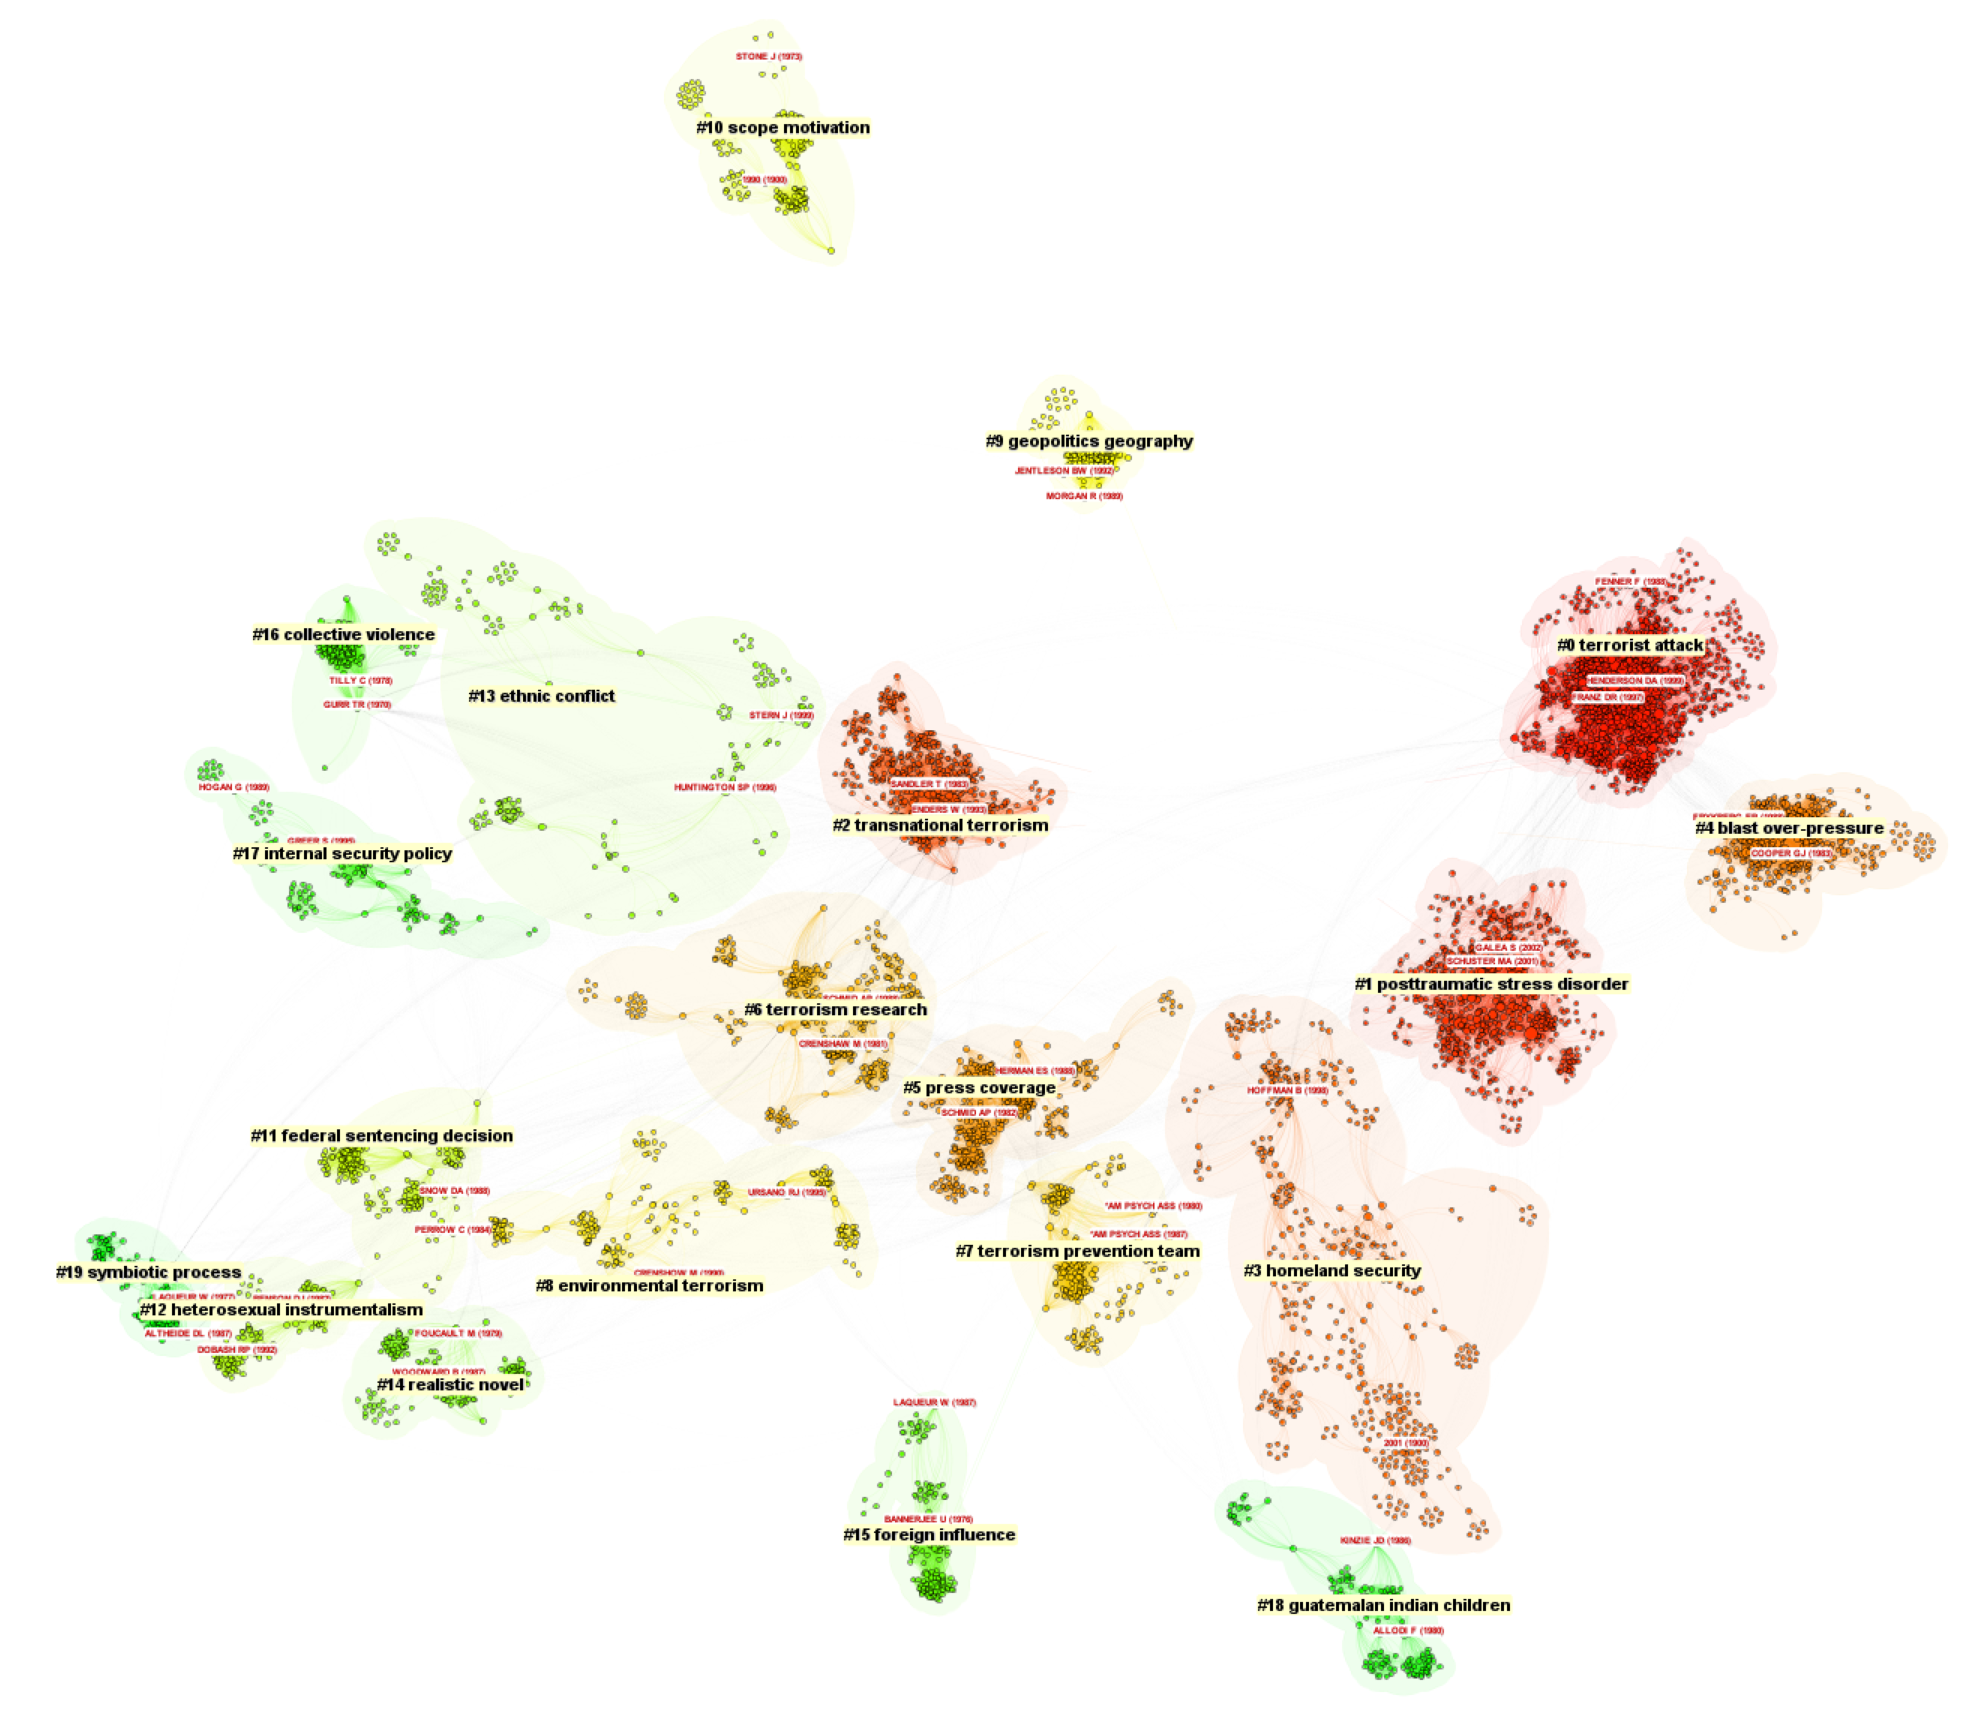
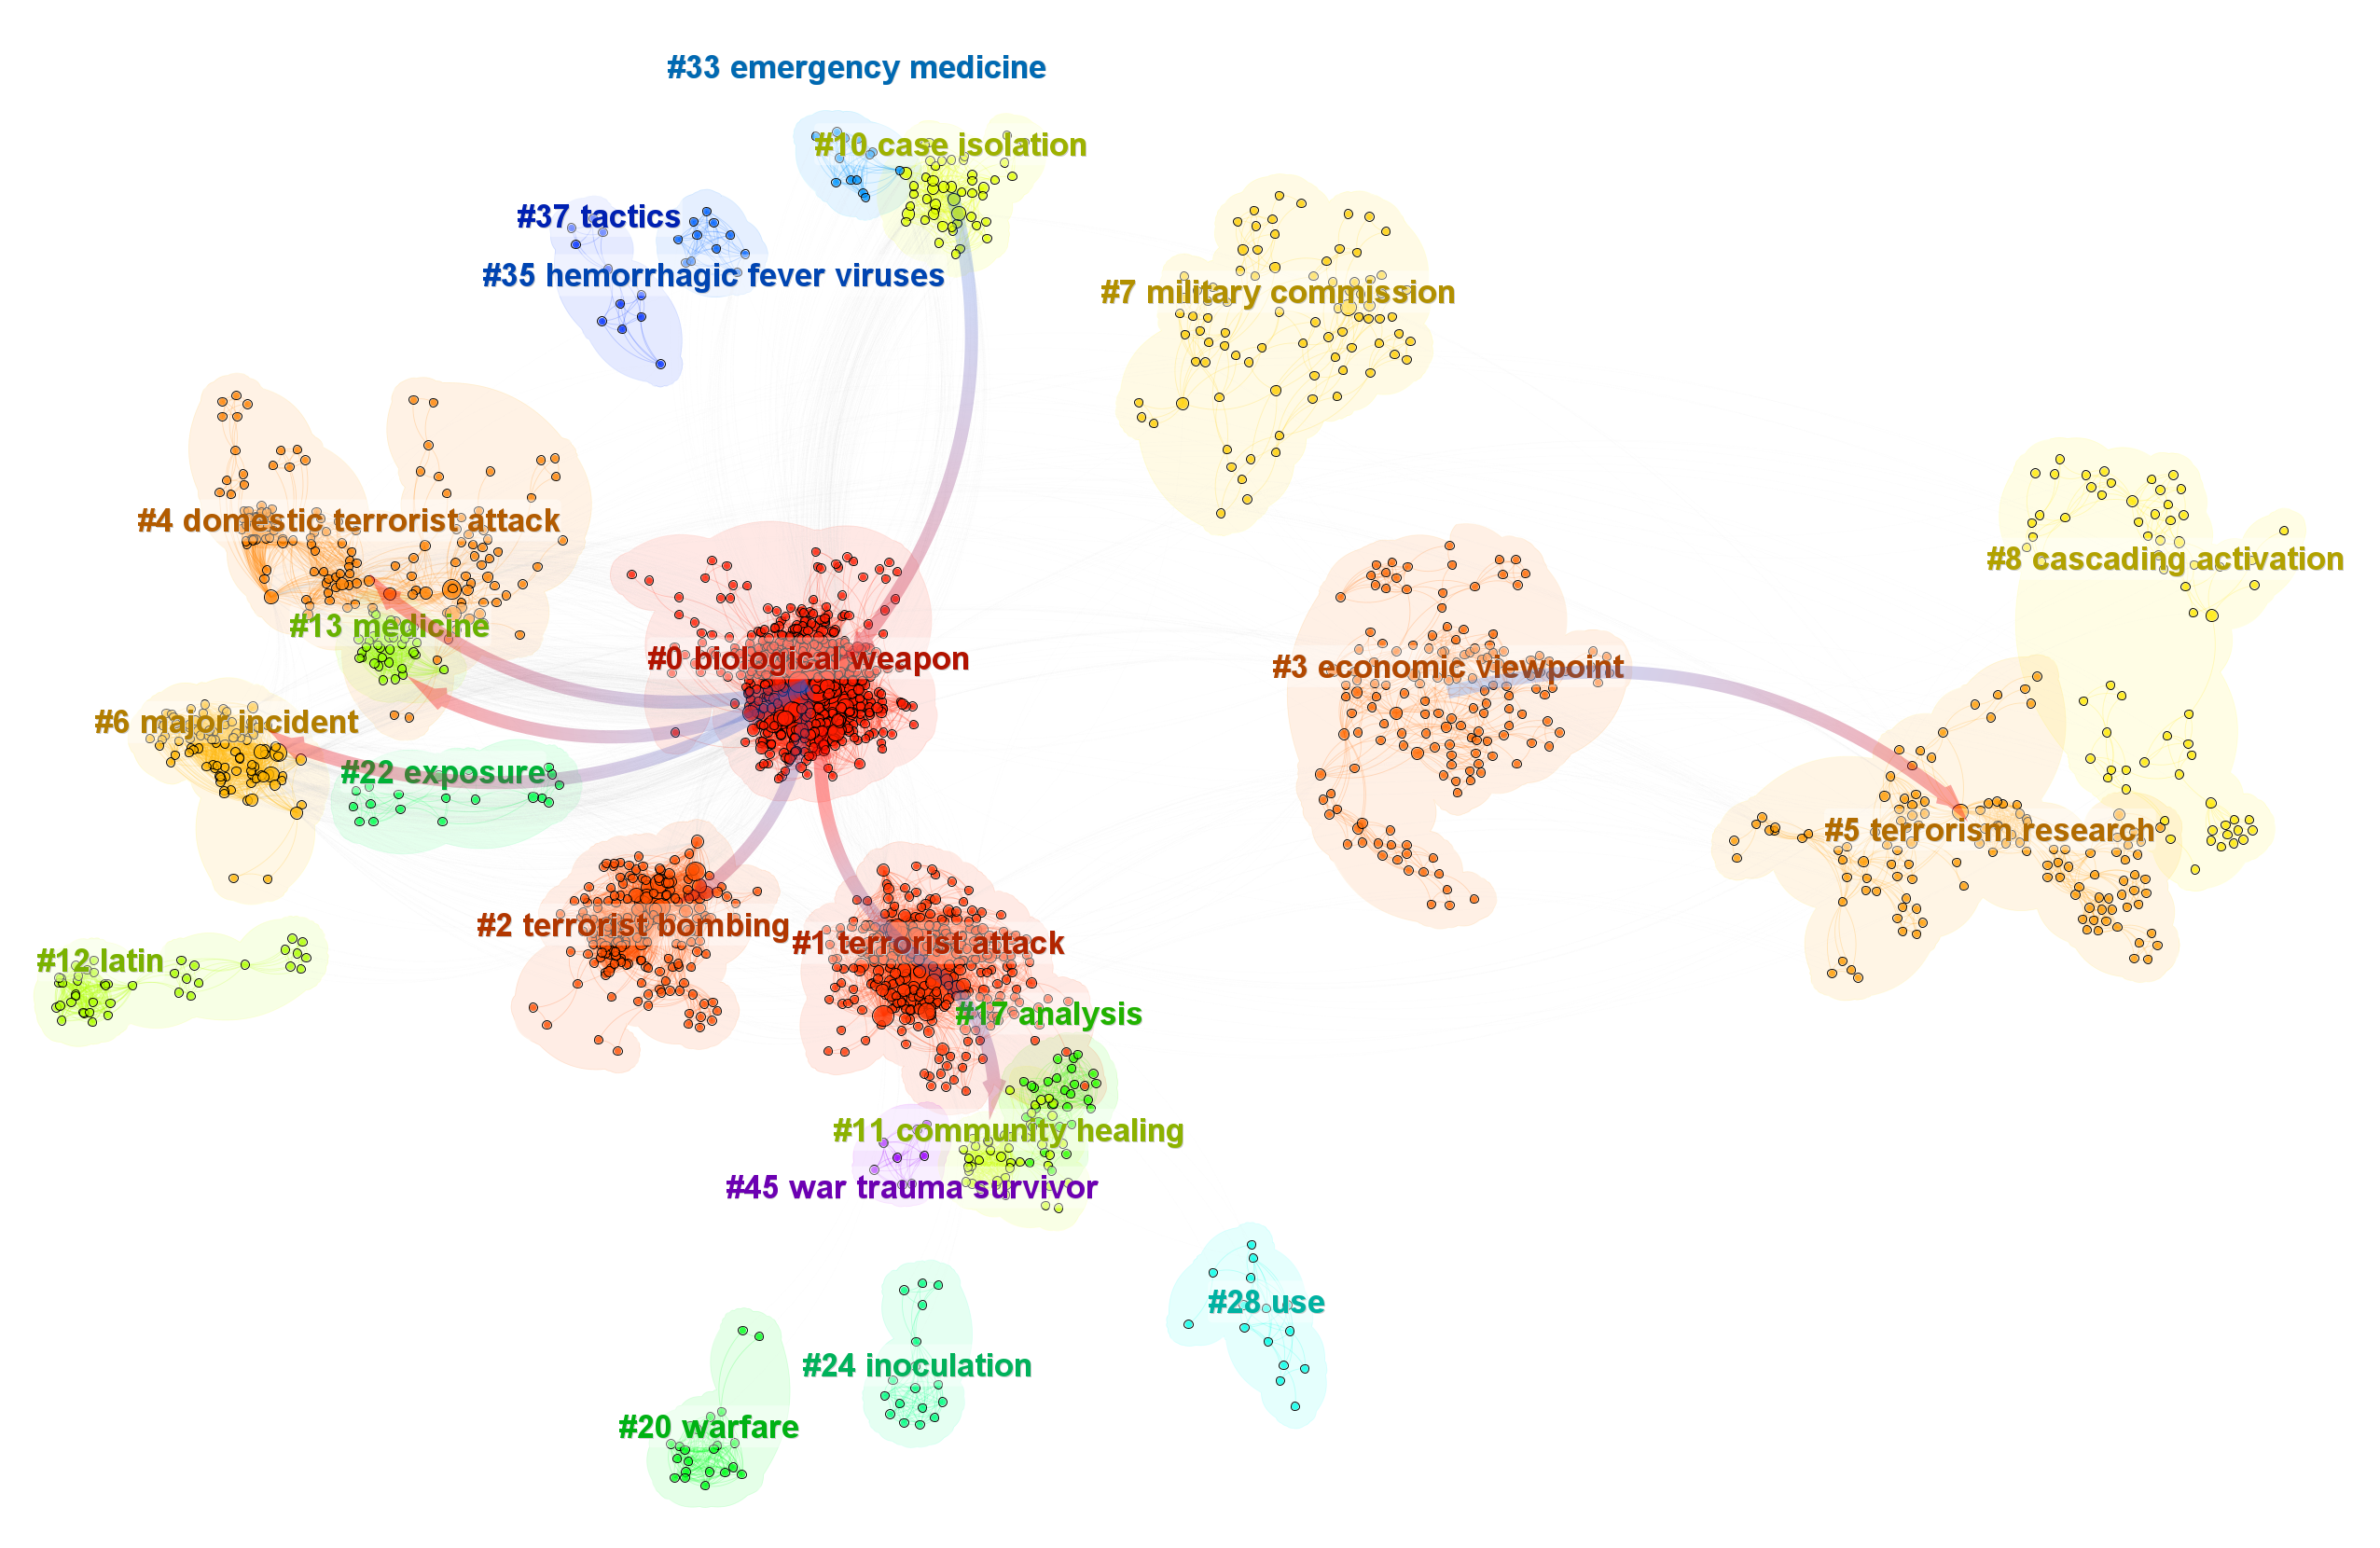
The landscape view of the same network. The largest 5 clusters (the number is customizable) were summarized by AI.

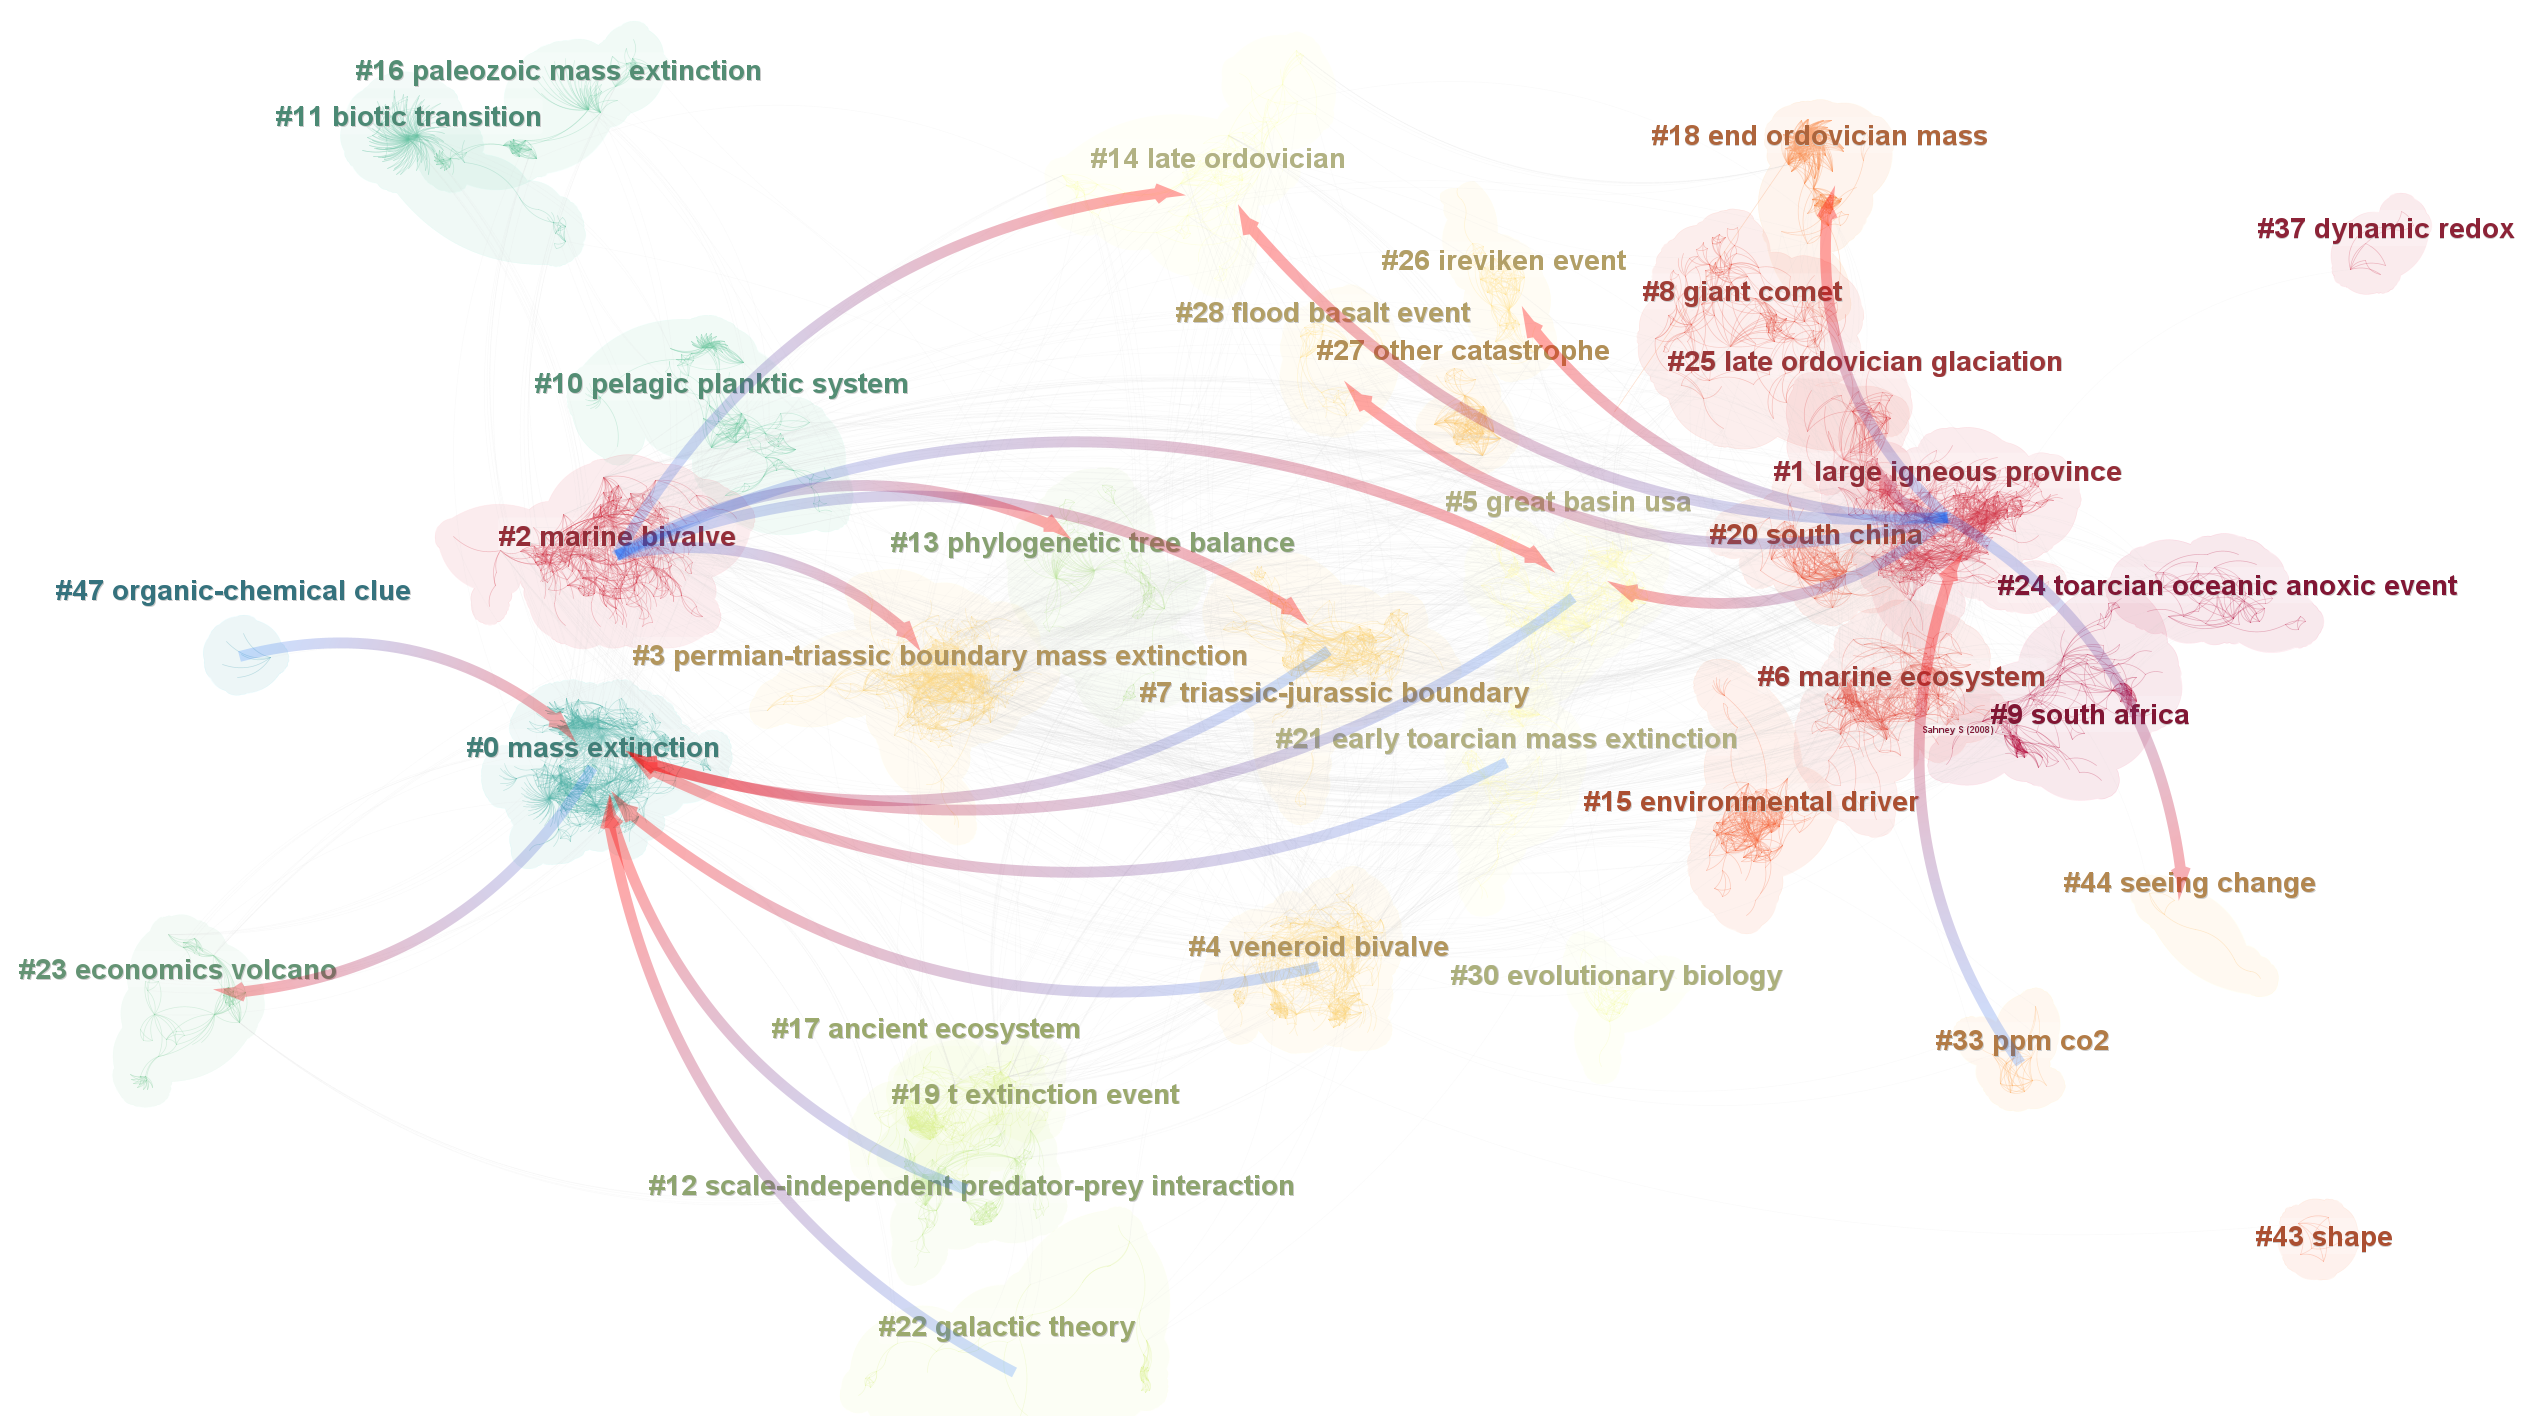
A co-citation network of cited references.

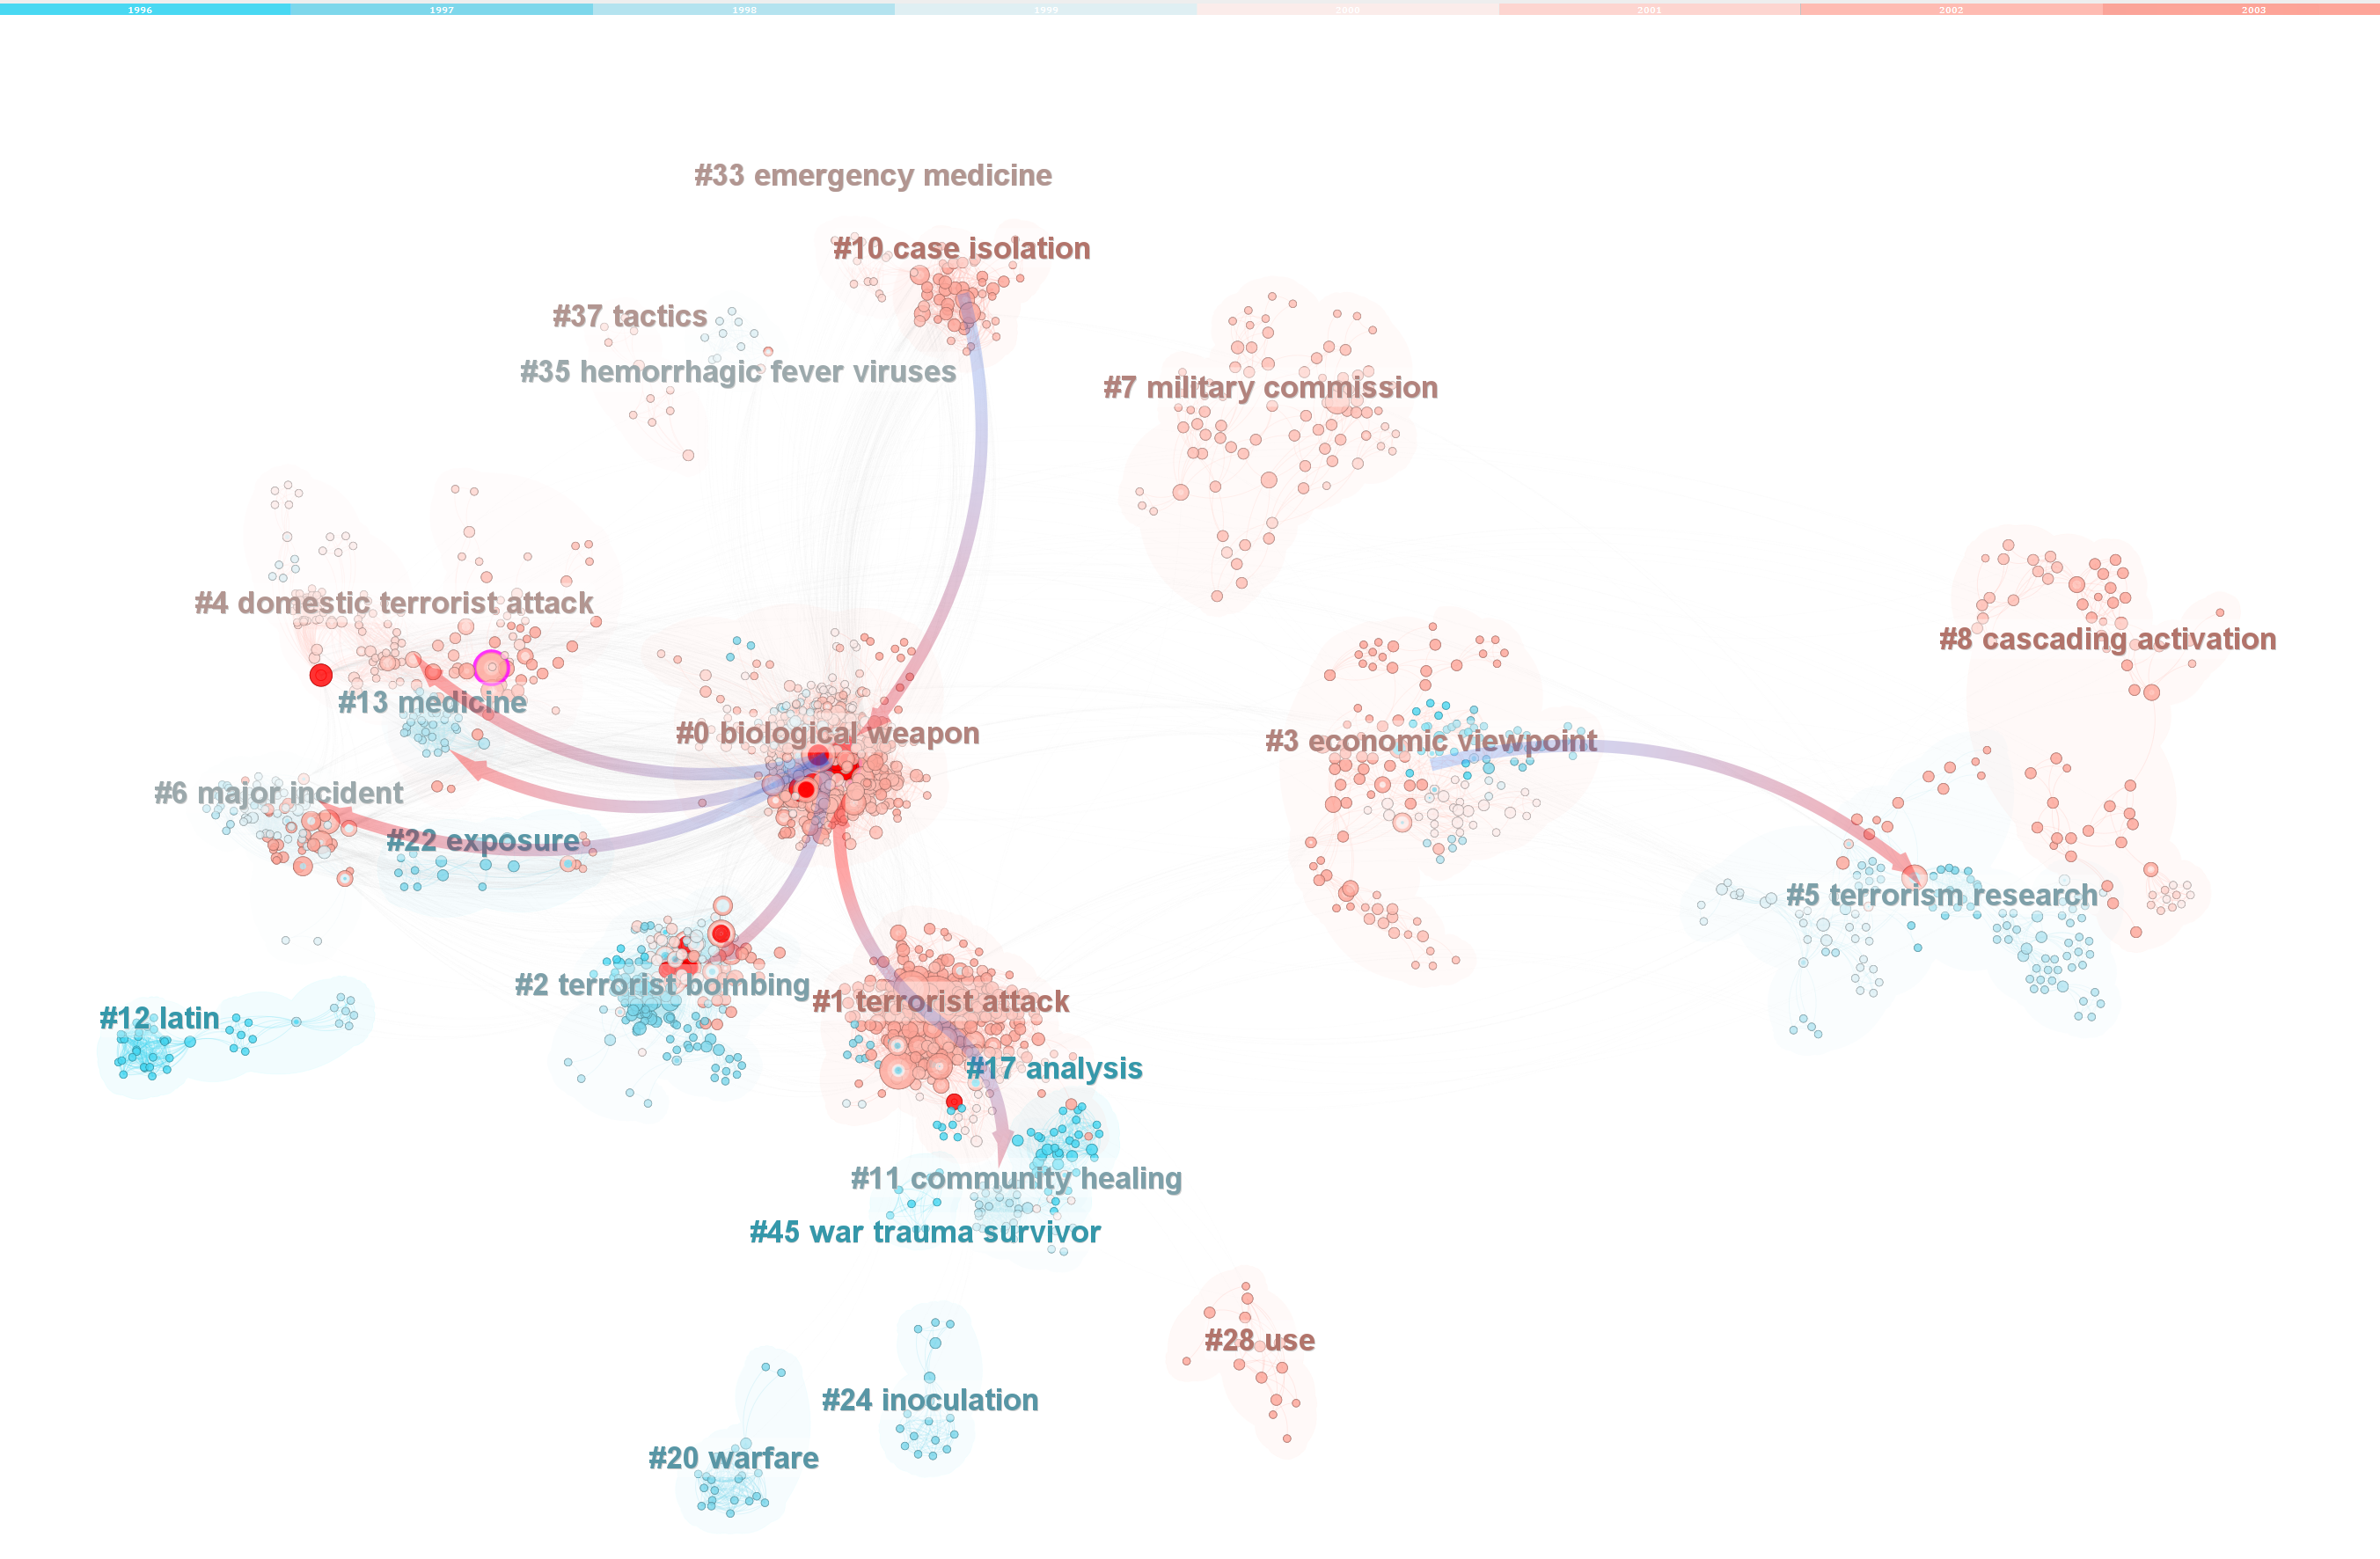
Chronologically colored. The time moves from the bottom (purple/blue) of the color legend to the top (red).

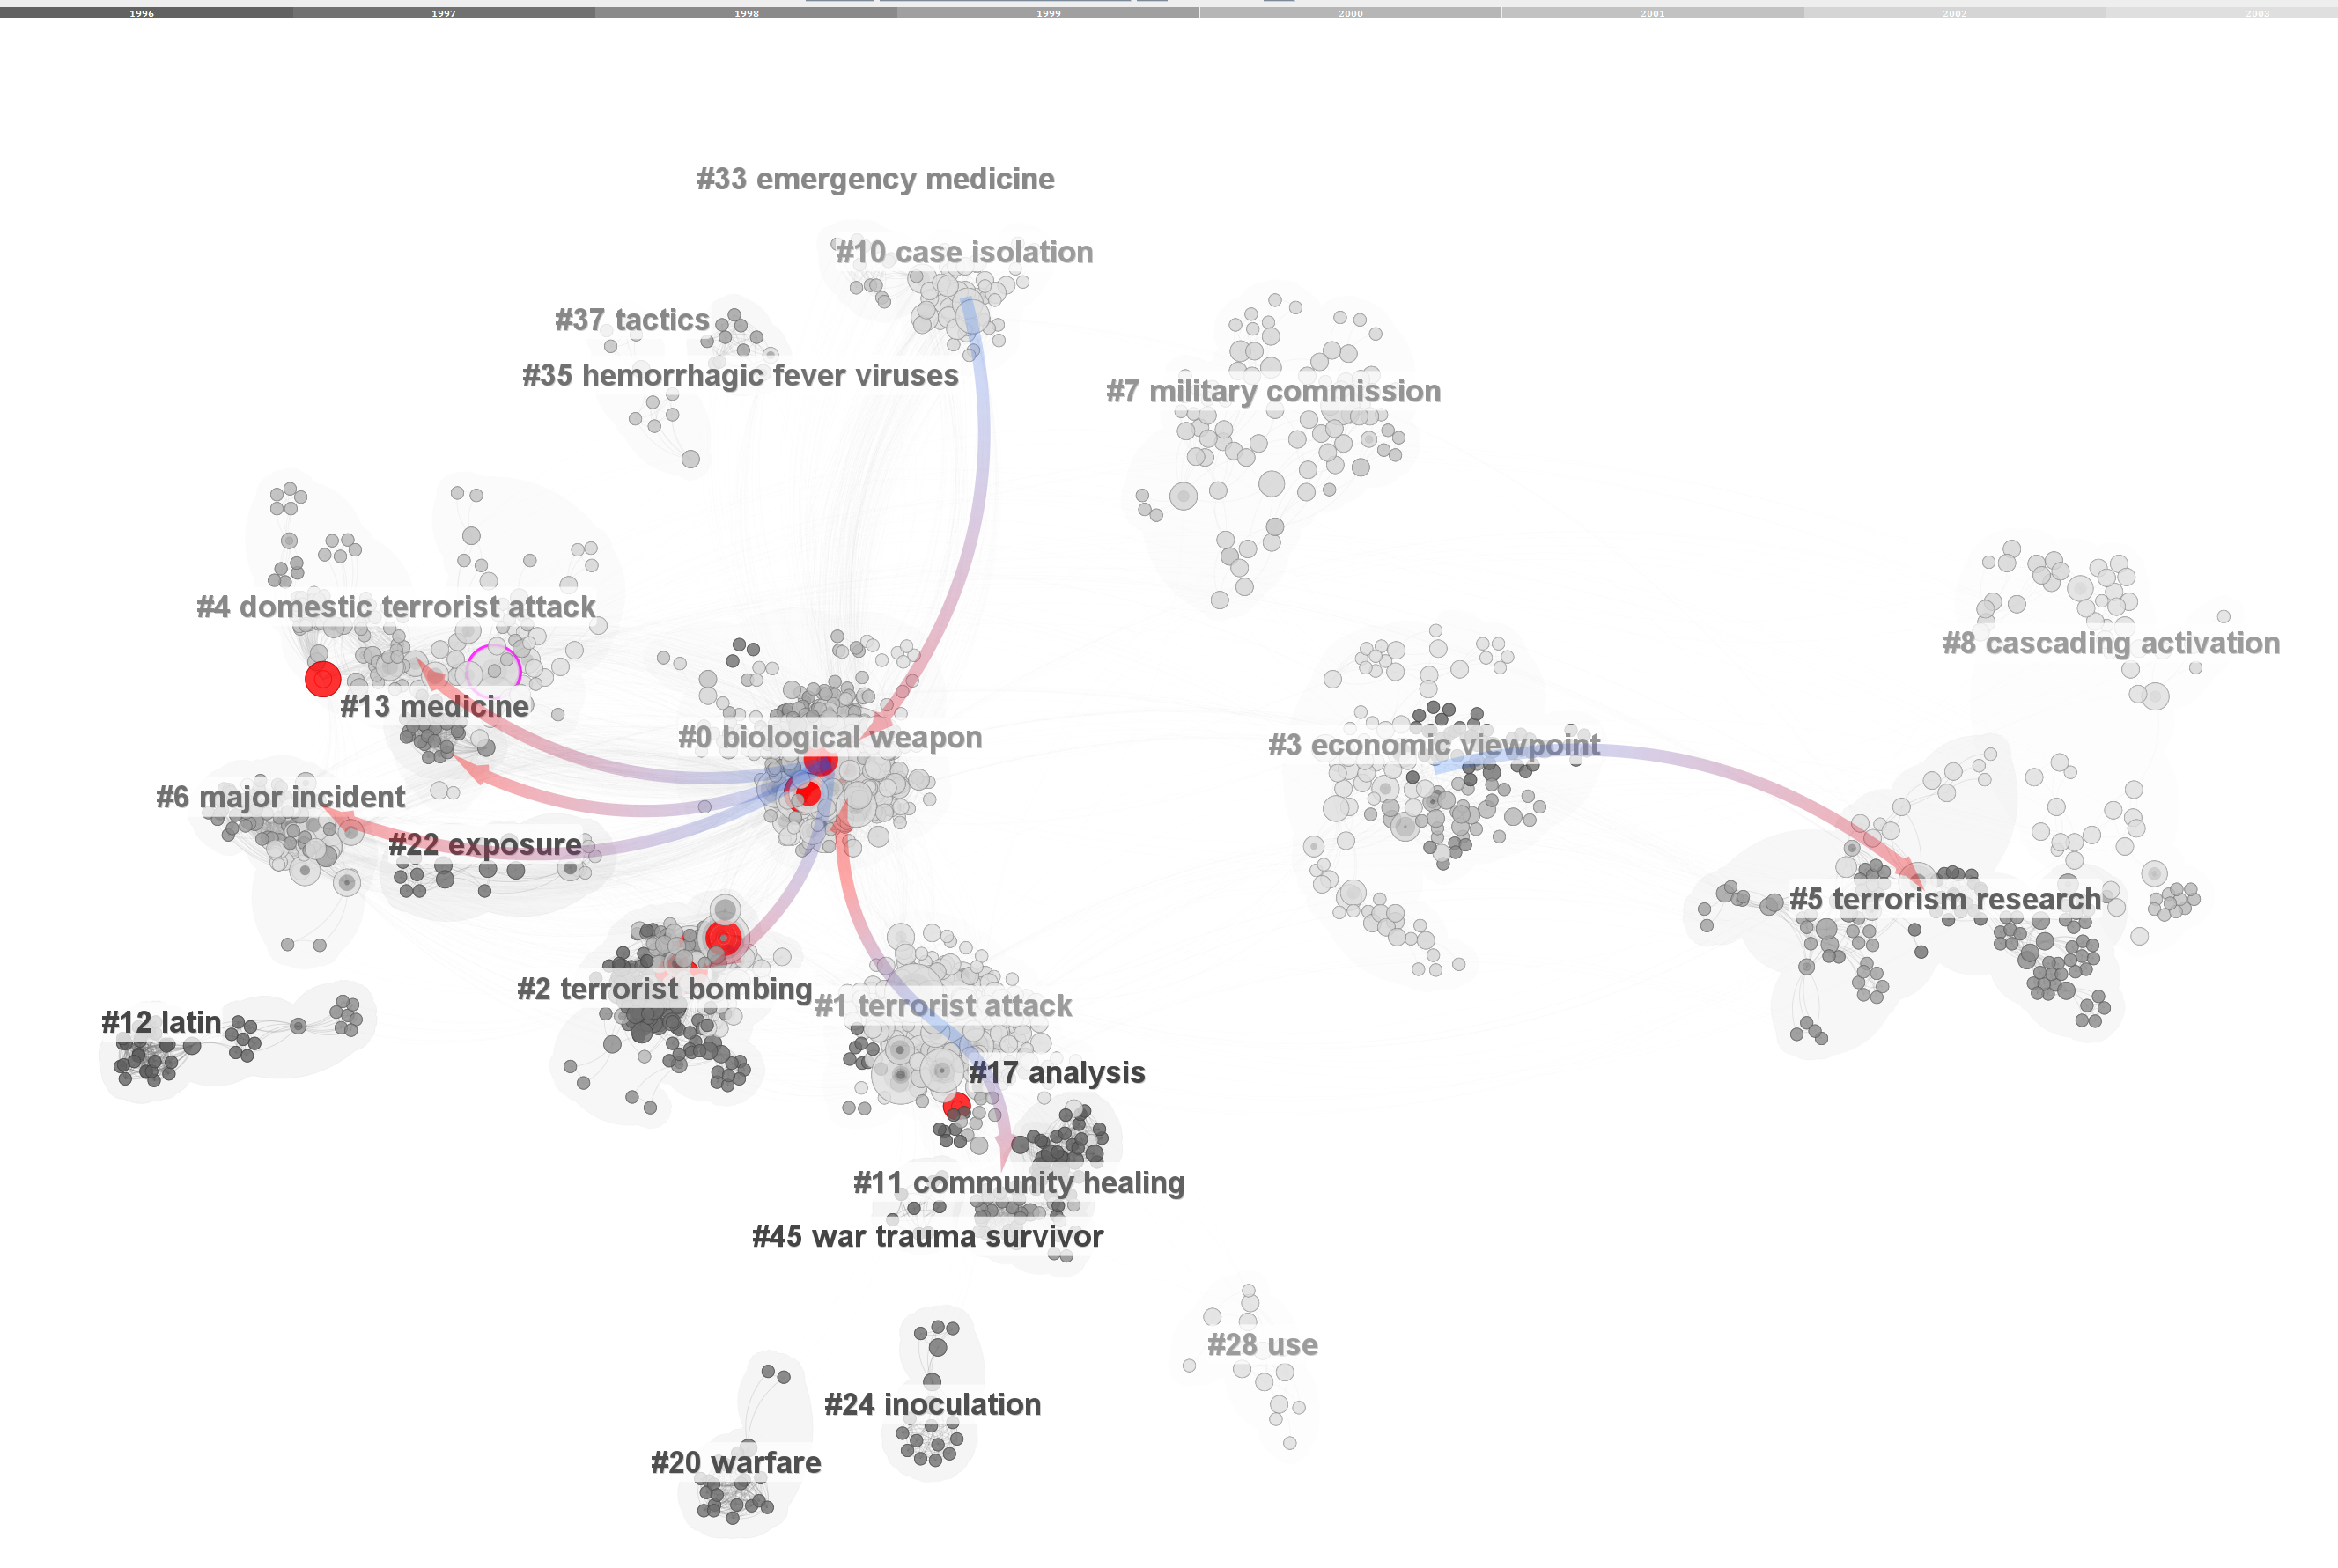
Cluster-based rainbow colors. The largest cluster is colored in red.

A network overlay

8/28/2024

How Did Review Papers Cite Differently from Other Types of Articles?

Data Source: Dimensions; Query: It's complicated :-)

Emerging Technologies (1990-2024)

Dimensions: Query = terroris*

Terrorism Research (1990-2024)

6.3.R3 Advanced (8/5/2024): g-index (k=500), LRF=1.5, L/N=20, LBY=10, e=1.0. N=26,492, E=67,312. LCC=8,843. Q=0.972. S=0.9756. H=0.9738.

Oldest clusters: #15 traumatic injury; #16 sarin poisoning; Youngest clusters: #7 violent extremism; Longest clusters: #5 blast injury; Largest cluster: #0 terrorist attack.

Dimensions: query = terroris*

Terrorism Research (1990-2024)

6.3.R3 Advanced: g-index (k=100), LRF=3.0, L/N=10, LBY=5, e=1.0. N=8,004, E=35,313. LCC: 5,306. Q=0.9139. S=0.9418. H=0.9276

Terrorism Research (1990-2003)

6.3.R1: Top 100% (100K), LRF=-1, L/N=-1, LBY=-1, e=0.0. N=31,546, E=771,040. LCC:24,984. Q=0.9568. S=0.9633. H=0.96.

Left (with), e.g., biological agent, natural threat, and mental illness; Right (without). Both depict 24,984 references, but clusters are not all the same.

With time slicing

Without time slicing

Mass Extinctions research (1982-2021)

The attention space moves from the lower left (1981) to the upper right (2010, 2017) at a relatively steady pace. Most of the clusters were built on their youngest predecessors.

Terrorism (1990-2003)

6.2.R7: g-index (k=1,000), LRF=-1, L/N=-1, LBY=-1, e=0.0. N=12,756, E=226,585. LCC:8,727. Q=0.9552. S=0.9599. H=0.9576.

Cluster Dependencies and Colormaps

CiteSpace 6.2.R4 (8/26/2023)

Information Visualization and Visual Analytics

(2000-2021)

Cluster View

Cluster Dependencies

Cluster View (SVG)

Circular View

Circular View

Cluster Dependencies

Landscape View

Timeline View

Landscape View

CiteSpace 6.2.R4 Advanced (Forthcoming)

Circular View

CiteSpace 6.2.R4 Advanced (Forthcoming)

Inflation and Recession

GPT defined cluster labels. Adjustable layout by cluster. Arrows of cluster dependency.

CiteSpace 6.2.R3 (64-bit) Advanced. April 30, 2023 at 11:24:10 AM EDT

An overview of the research landscape of Terrorism

(1990-2003)

Selection Criteria: g-index (k=100), LRF=3.0, L/N=10, LBY=-1, e=0.0
Modularity Q=0.9159, Weighted Mean Silhouette S=0.9385, Harmonic Mean (Q, S)=0.9271 

CiteSpace, v. 6.1.R6 (64-bit) Advanced. March 1, 2023 at 10:15:07 PM EST

Terrorism 1990-2003

Keywords + References

Selection Criteria: Top 100.0% per slice, up to 1M, LRF=-1.0, L/N=-1, LBY=-1, e=0.0
Network: N=32144, E=851384; LCC: 25981 (80%); Pruning: None
Modularity Q=0.9344, Weighted Mean Silhouette S=0.9459, Harmonic Mean (Q, S)=0.9401
A hybrid network

11/24/2022

Patent Citation Analysis

2001 FEB - 2021 AUG

A hybrid network of bursting terms, publications, and patents on COVID-19 vaccines and related topics. Node Type: Terms, Reference. g-index (k=1,000). N=4,148, E=14,635. LCC=2,944 (70%). Q=0.9267, S=0.9707. Harmonic=0.9482.

Peaks and troughs of thematic topics on inflation and recession. 8/31/2022.

Main paths in context. 6.1.R3 Advanced.
The LCC contains 10,424 nodes, which represent 40% of a hybrid network of 25,511 nodes. Configuration: g-index (k=1,000). LRF=1.0, L/N=3, LBY=2, e=0.0. Created with CiteSpace 6.1.R3 Advanced (Built 7/24/2022).
A hybrid network of citing terms nad cited references. Labeled nodes are cited references with strong citation bursts.

Network

A hybrid network of citing terms and cited references.

Term

Frequencies of the term financial crisis, peaked in 2013 and 2018.
Advanced (中文版). So far top-level menus are in Chinese.

Patent Citation Analysis

Patents on electric vehicles and what they cite: terms from a patent's title and abstract (crosses), patents they cite (balls), and publications they cite (red stars).
Inflation and recession. Data Source: Dimensions: Export for bibliometric mapping. Citation bursts: nodes with red rings. Paths: connecting nodes of high degree centrality. Clusters are labeled by title words of citing articles to each cluster.
Visual encodings: Purple rings: high betweenness centrality; Red tree-rings: duration of citation burstness; Thicker links: connections between high-degree nodes.

Visual Analytics (2002-2022)

This visualization of the field of Visual Analytics (2002-2022) illustrates the growing impact of machine learning in the literature of visual analytics.

Basic

Advanced

Basic

Advanced

Twitter: The figure illustrates how Structural Variation Analysis (SVA) in #CiteSpace reveals boundary-spanning mechanisms. The red-star article stitches two clusters: (#0) dimensionality reduction and (#2) twitter. Can you see 3 red stars?
Readings:


Mass Extinctions (1982-2021)

Web of Science: Topic="Mass Extinctions"
Exported interactive map
Saved visualization (open it in CiteSpace)

Making New Connections

A link walkthrough highlights a distinct pattern emerged in 2016: emerging connections between three clusters: #0 central atlantic magmatic province, #1 sixth mass extinction, and #6 triassic-jurassic boundary.
Color=time. Red circles=articles with citation bursts.
The Literature of Visual Analytics (2002-2021).
Version: 5.8.R4 (beta); Data Source: WoS; Node Type: Cited References; Cluster Label Source: Title
Version: 5.8.R2; Data Source: CSSCI; Node Type: Keywords, Cited References; Cluster Label Source: Keywords
Information Visualization (1992-2021) in CiteSpace.

The same visualization as an interactive visualization in a web browser.

Citation Context and Uncertainty Analysis with MAG

For more details on citation analysis with Microsoft Academic Graph (MAG), see Chen (2020)
Required: CiteSpace 5.8.R1 beta; Microsoft Academic Graph API Token; MySQL 5.7 at localhost
In CiteSpace, a cluster is labeled based on citing articles responsible for its formation. If they are equally responsible for the formation of other clusters, then different clusters may share the same name, which may puzzle some users. From the next version (5.8.R2), all labels will be unique.

Coronavirus (1969-2020)

32,849 records from CORD-19 v. 10 converted by CiteSpace: Data>Import/Export>CSV 5/2/2020

Link Walkthrough (green) 1991-2003-2004-2020

Structural Variation Analysis (SVA) shows the boundary-spanning links added by O'Keefe J. 1971, which led to a Nobel Prize 40 years later.

Science of Science

CiteSpace 5.7.R4; Data Source: Dimensions
1955-2020 (Slice Length=1); g-index (k=25), LRF=2.0, LBY=10, e=1.0
Network: N=3,927, E=16,642, Largest CC: 3,076 (78%)

Science of Science

Climiate Change (2017)

A timeline view.