- Jan 17
CiteSpace 7.0.0
- Chaomei Chen
CiteSpace 7.0.0 is a major upgrade since 6.4.R2, including an optimized performance with much larger networks than previous versions, upgraded cluster summarizations with more recent large-language models (LLMs), more streamlined save and reopen saved visualization, and fixed unstable functions such as Save PNG and rotating labels in timeline views. The current 7.0 is still an experiment version before it settles. This blog will serve as a living document to share with you new features and optimizations of new releases of CiteSpace 7.0.0
2/18/2026 Update
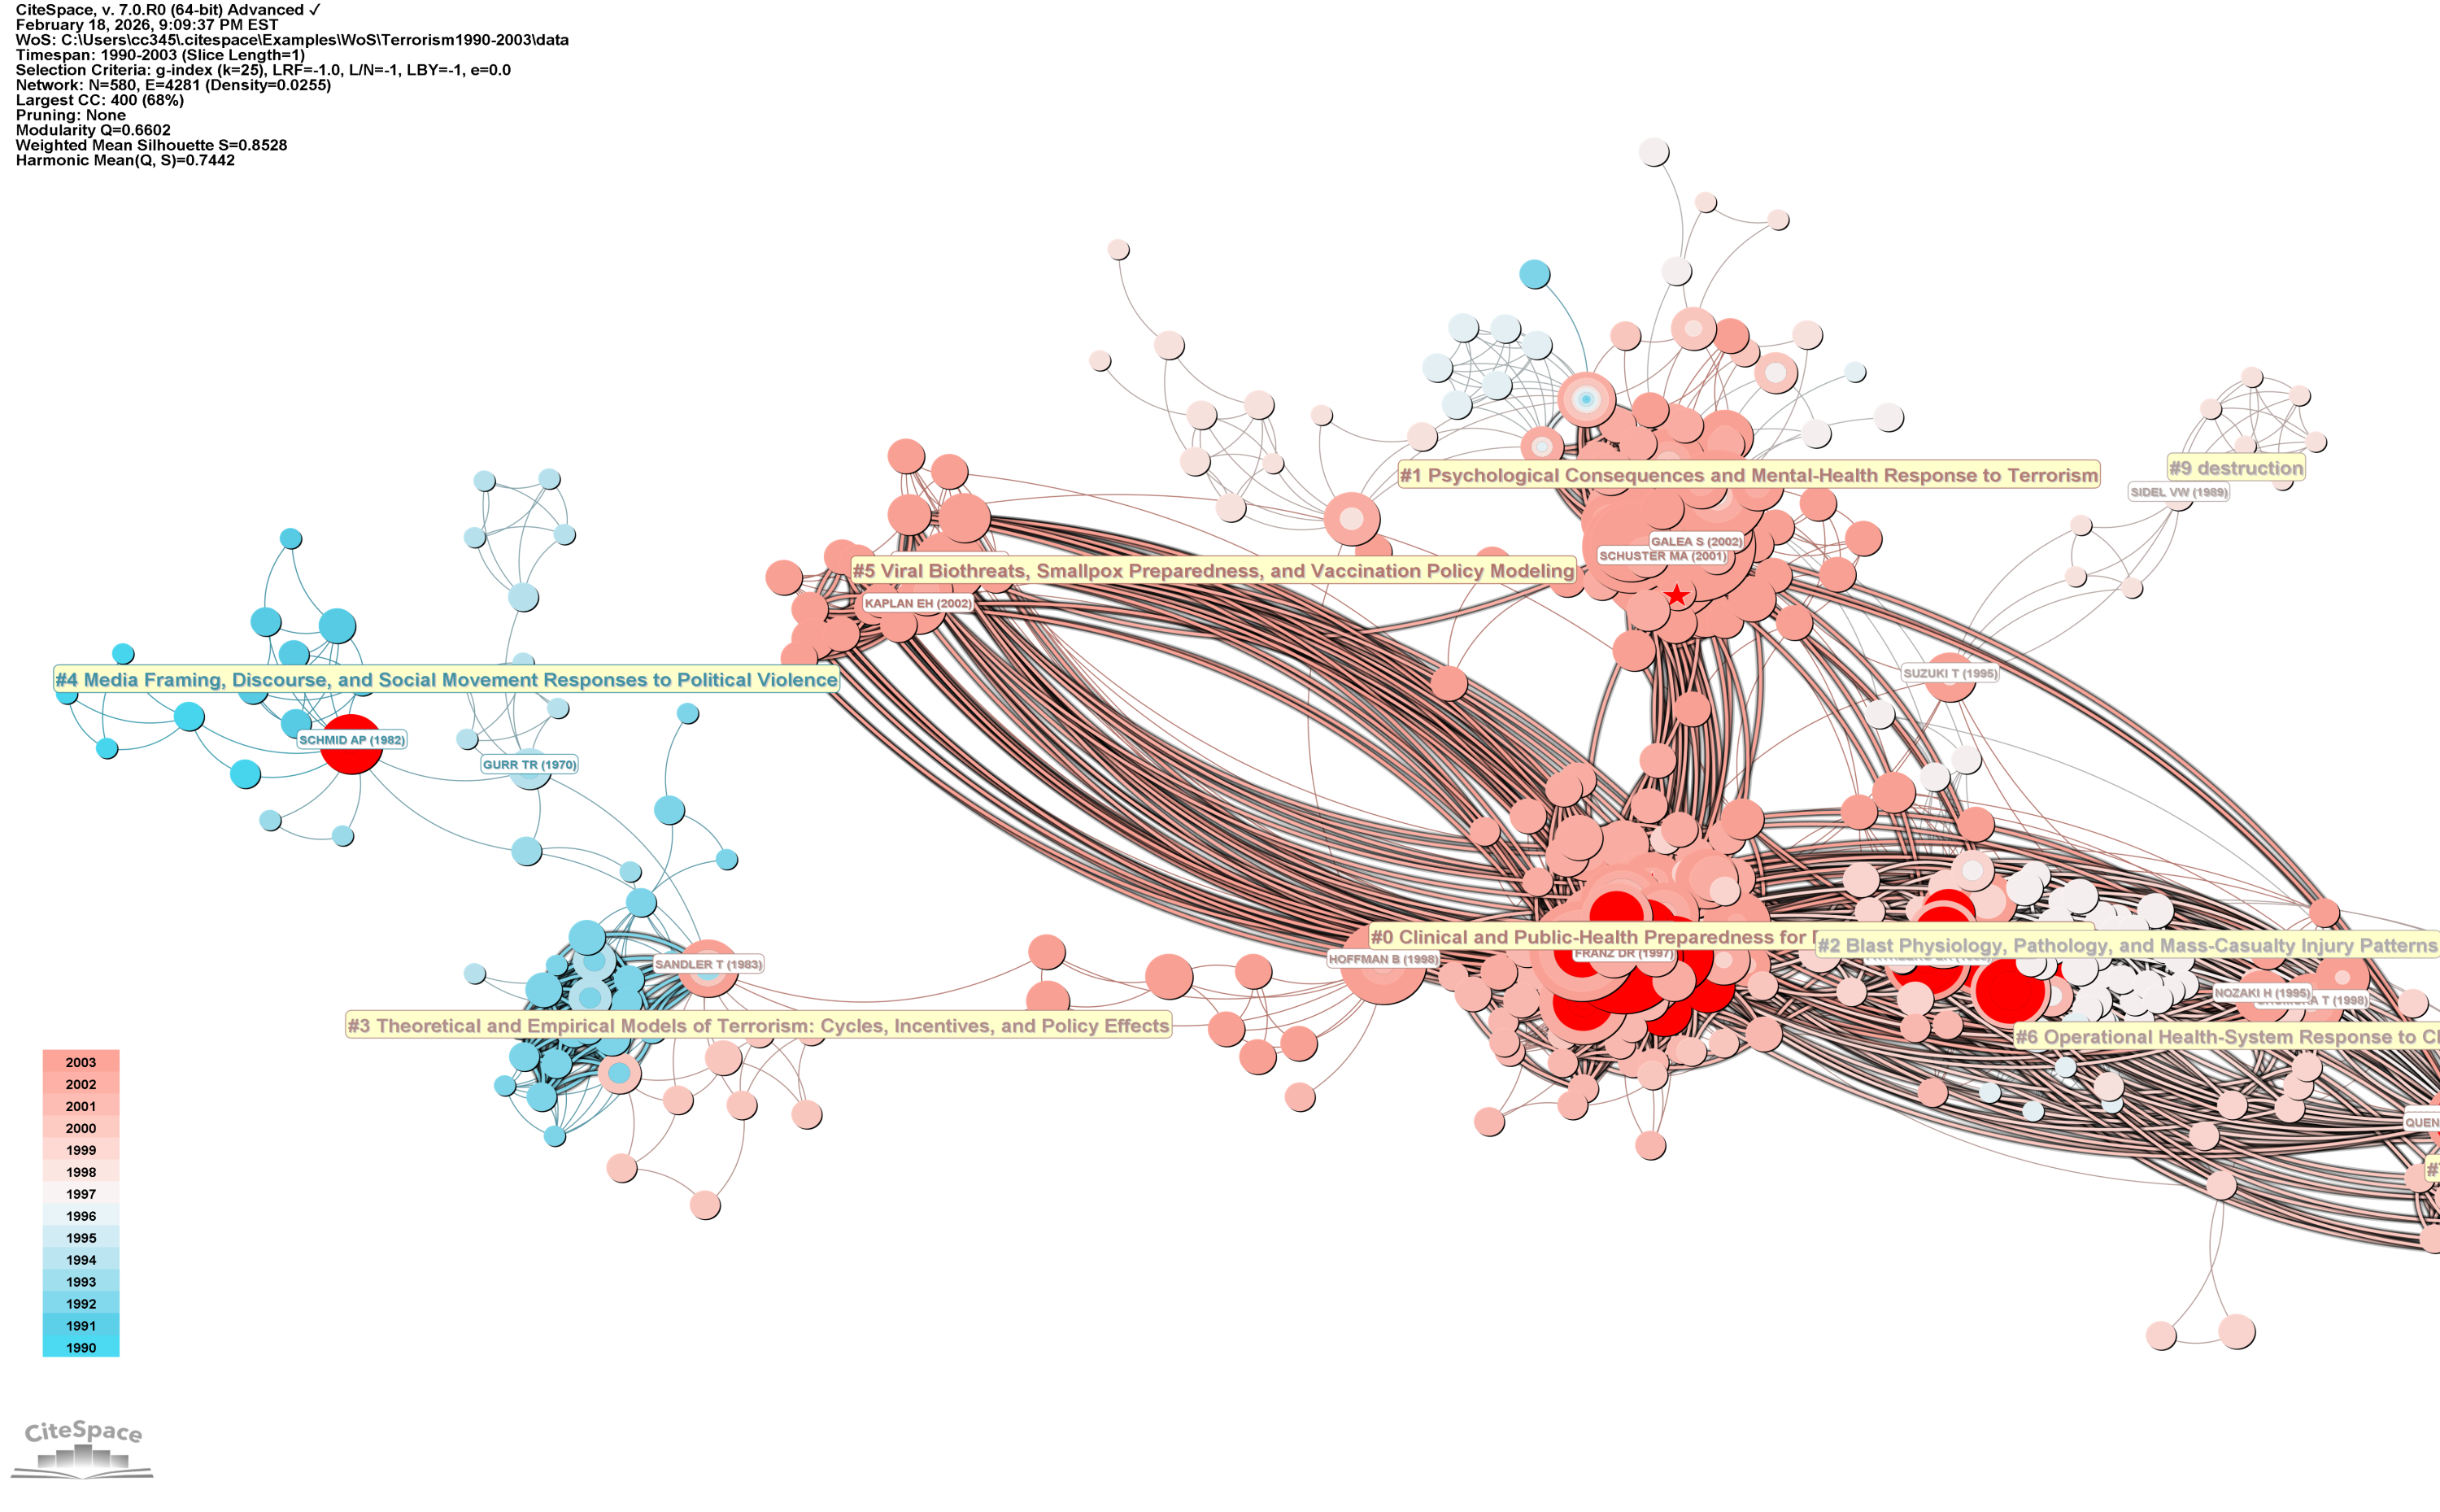
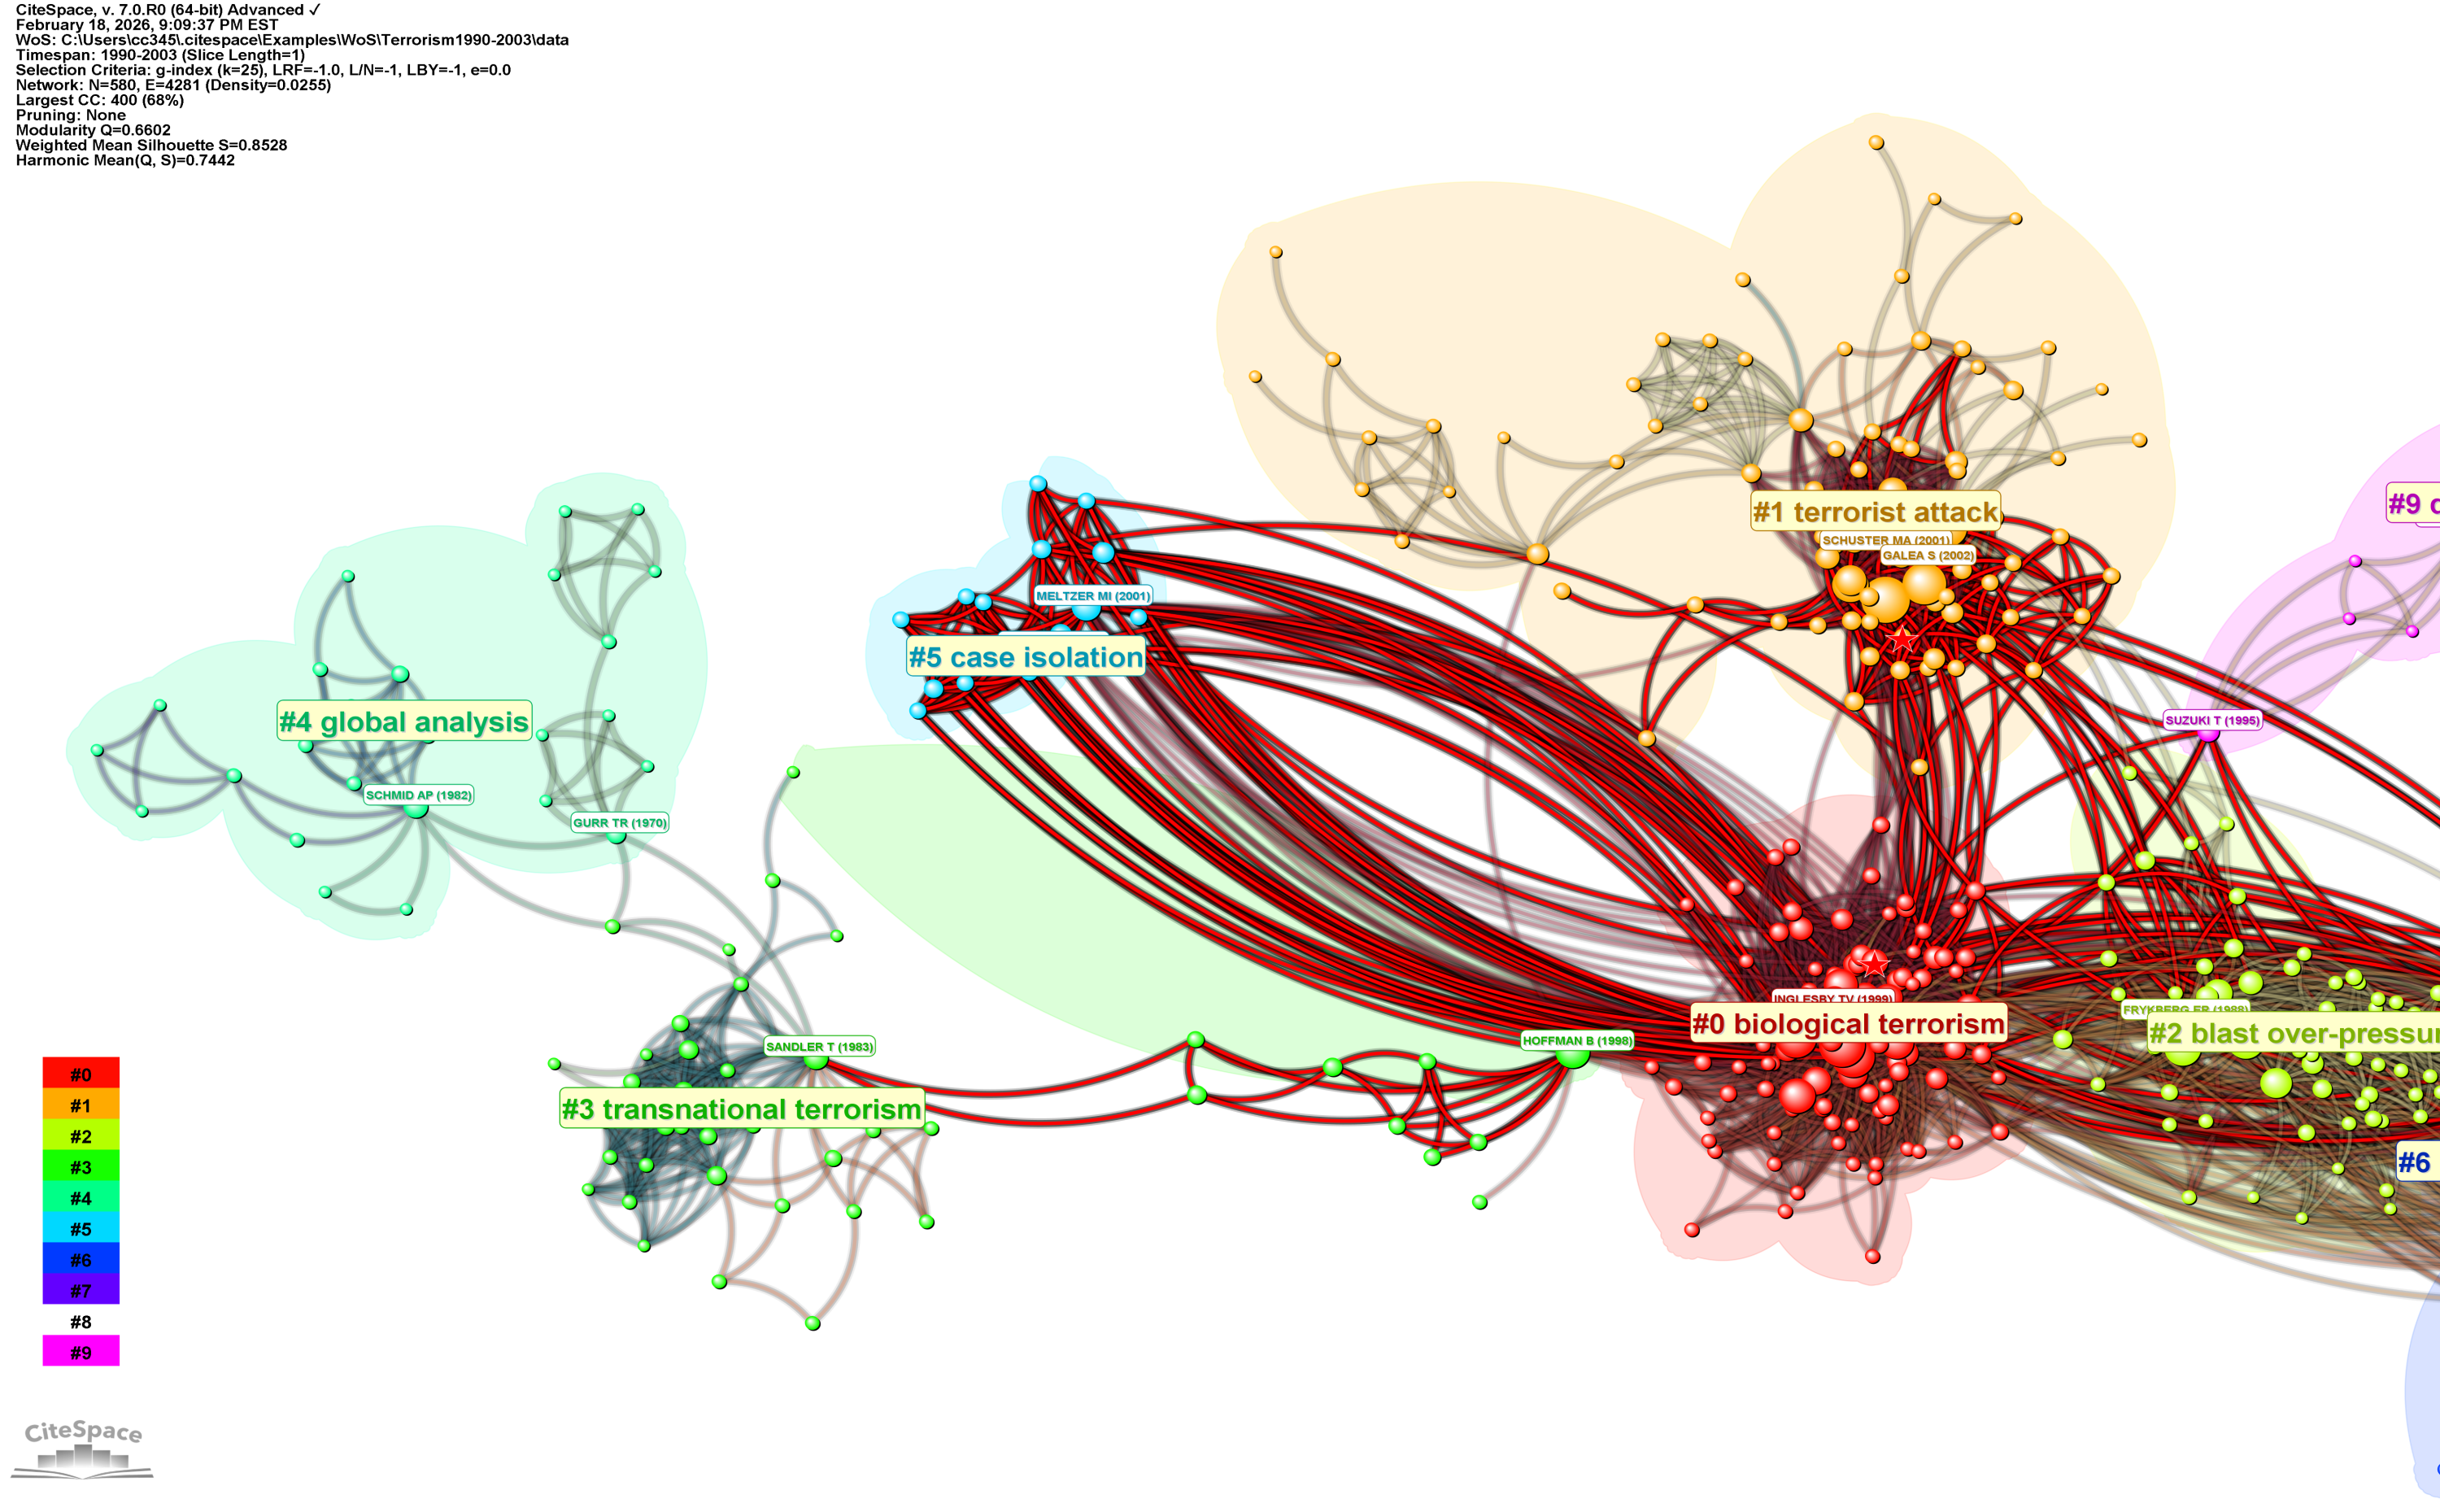
Silhouette and Harmonic Scores now have been restored. Link Walkthrough is slightly modified.
2/9/2026 Update
Now 7.0.0 is available for Mac arm64 (M1-M4) and x86-64.
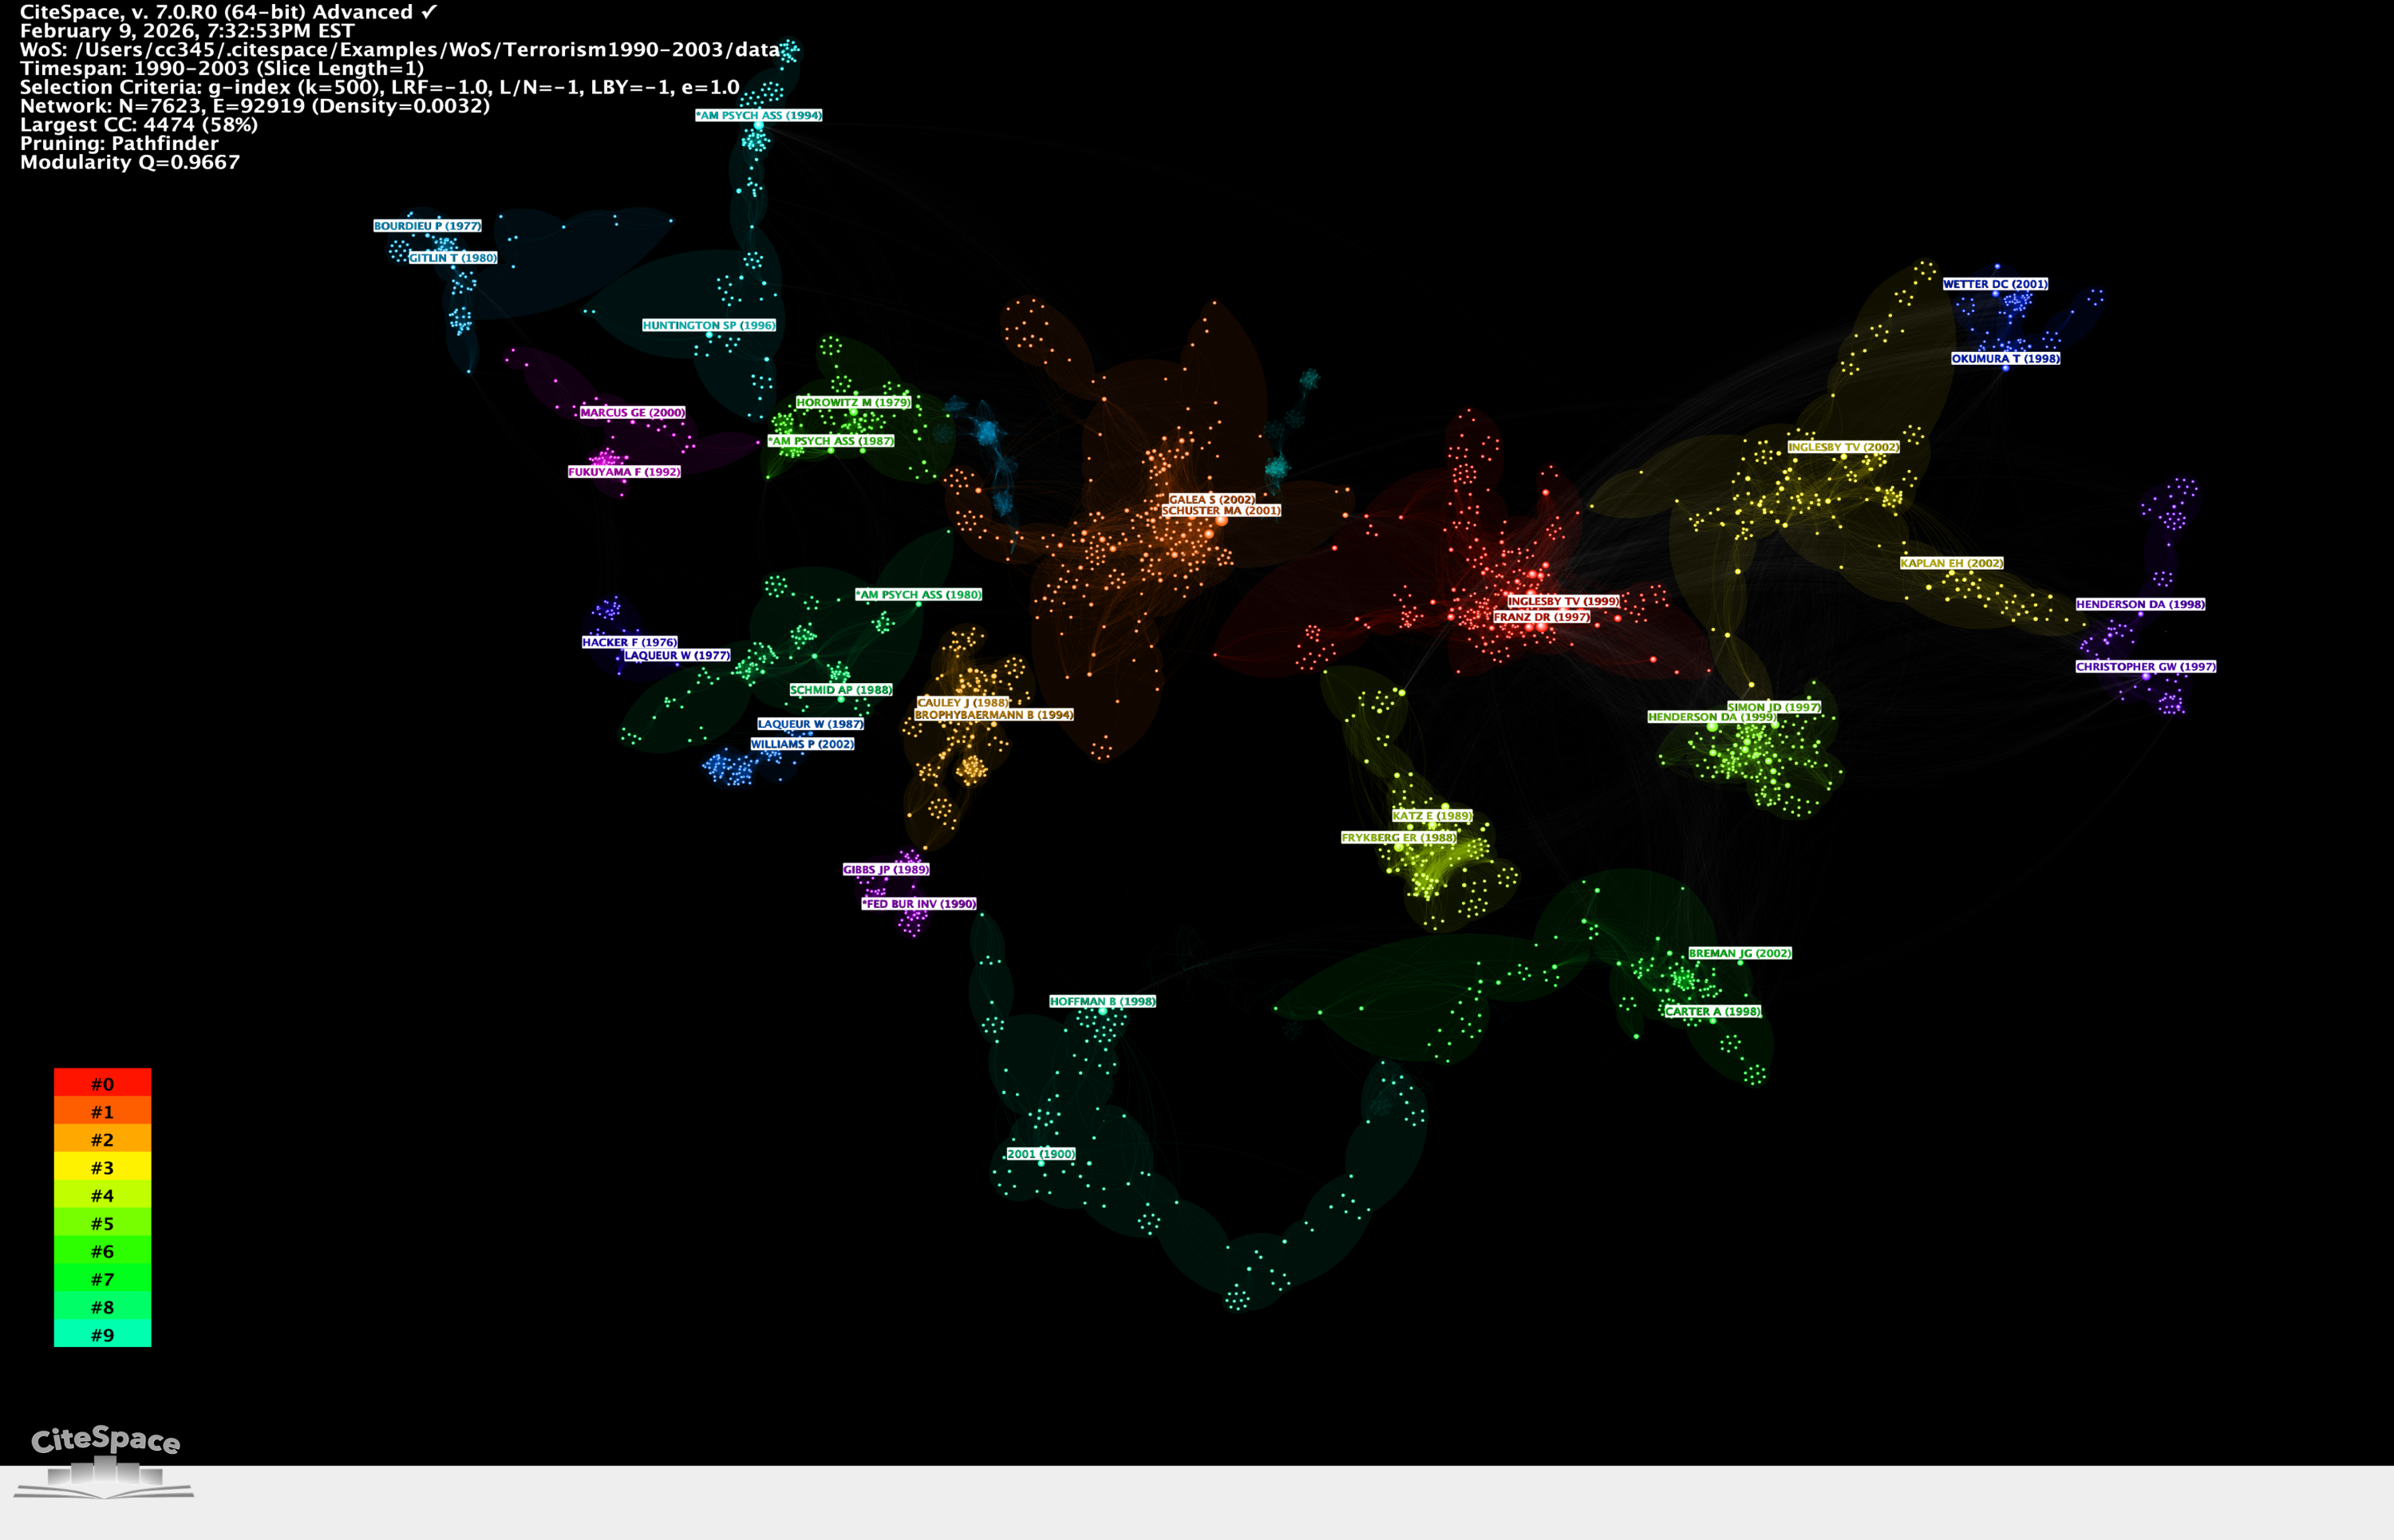
The following is the 4,474-node largest connected component of a Pathfinder network of 7,623 nodes and 92,919 links.
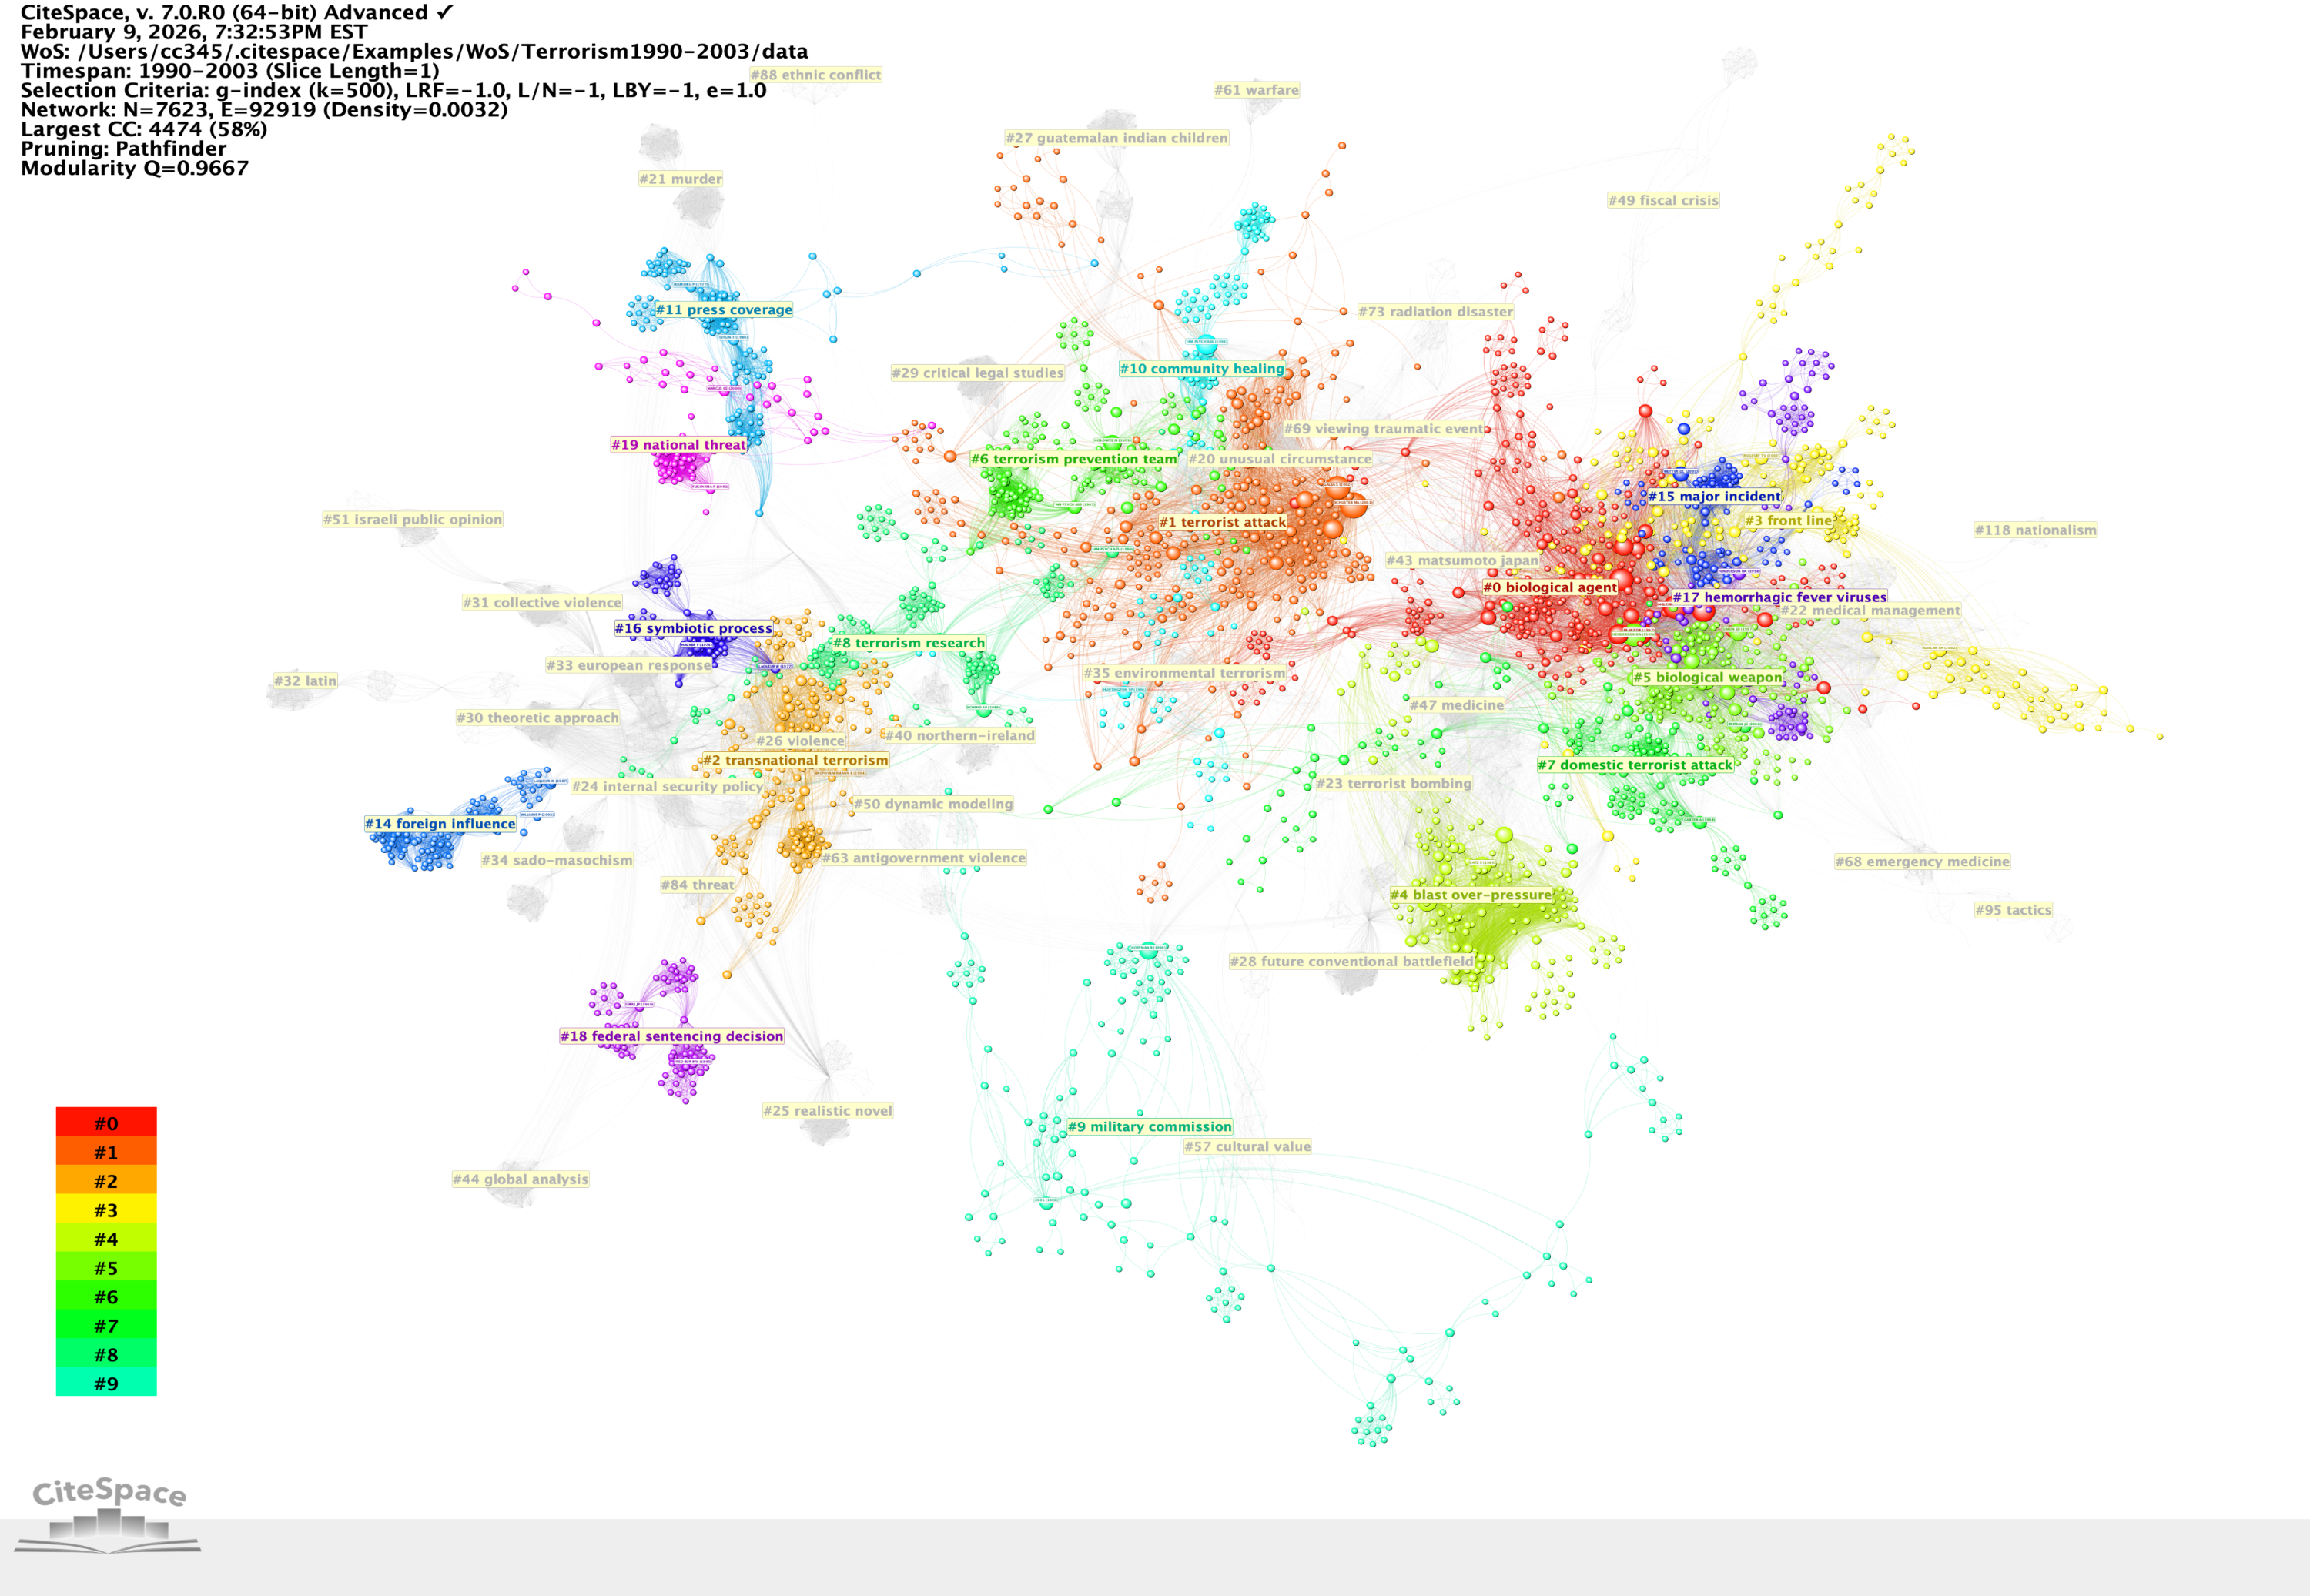
The visualization below depicts an optimized layout - no overlapping clusters.
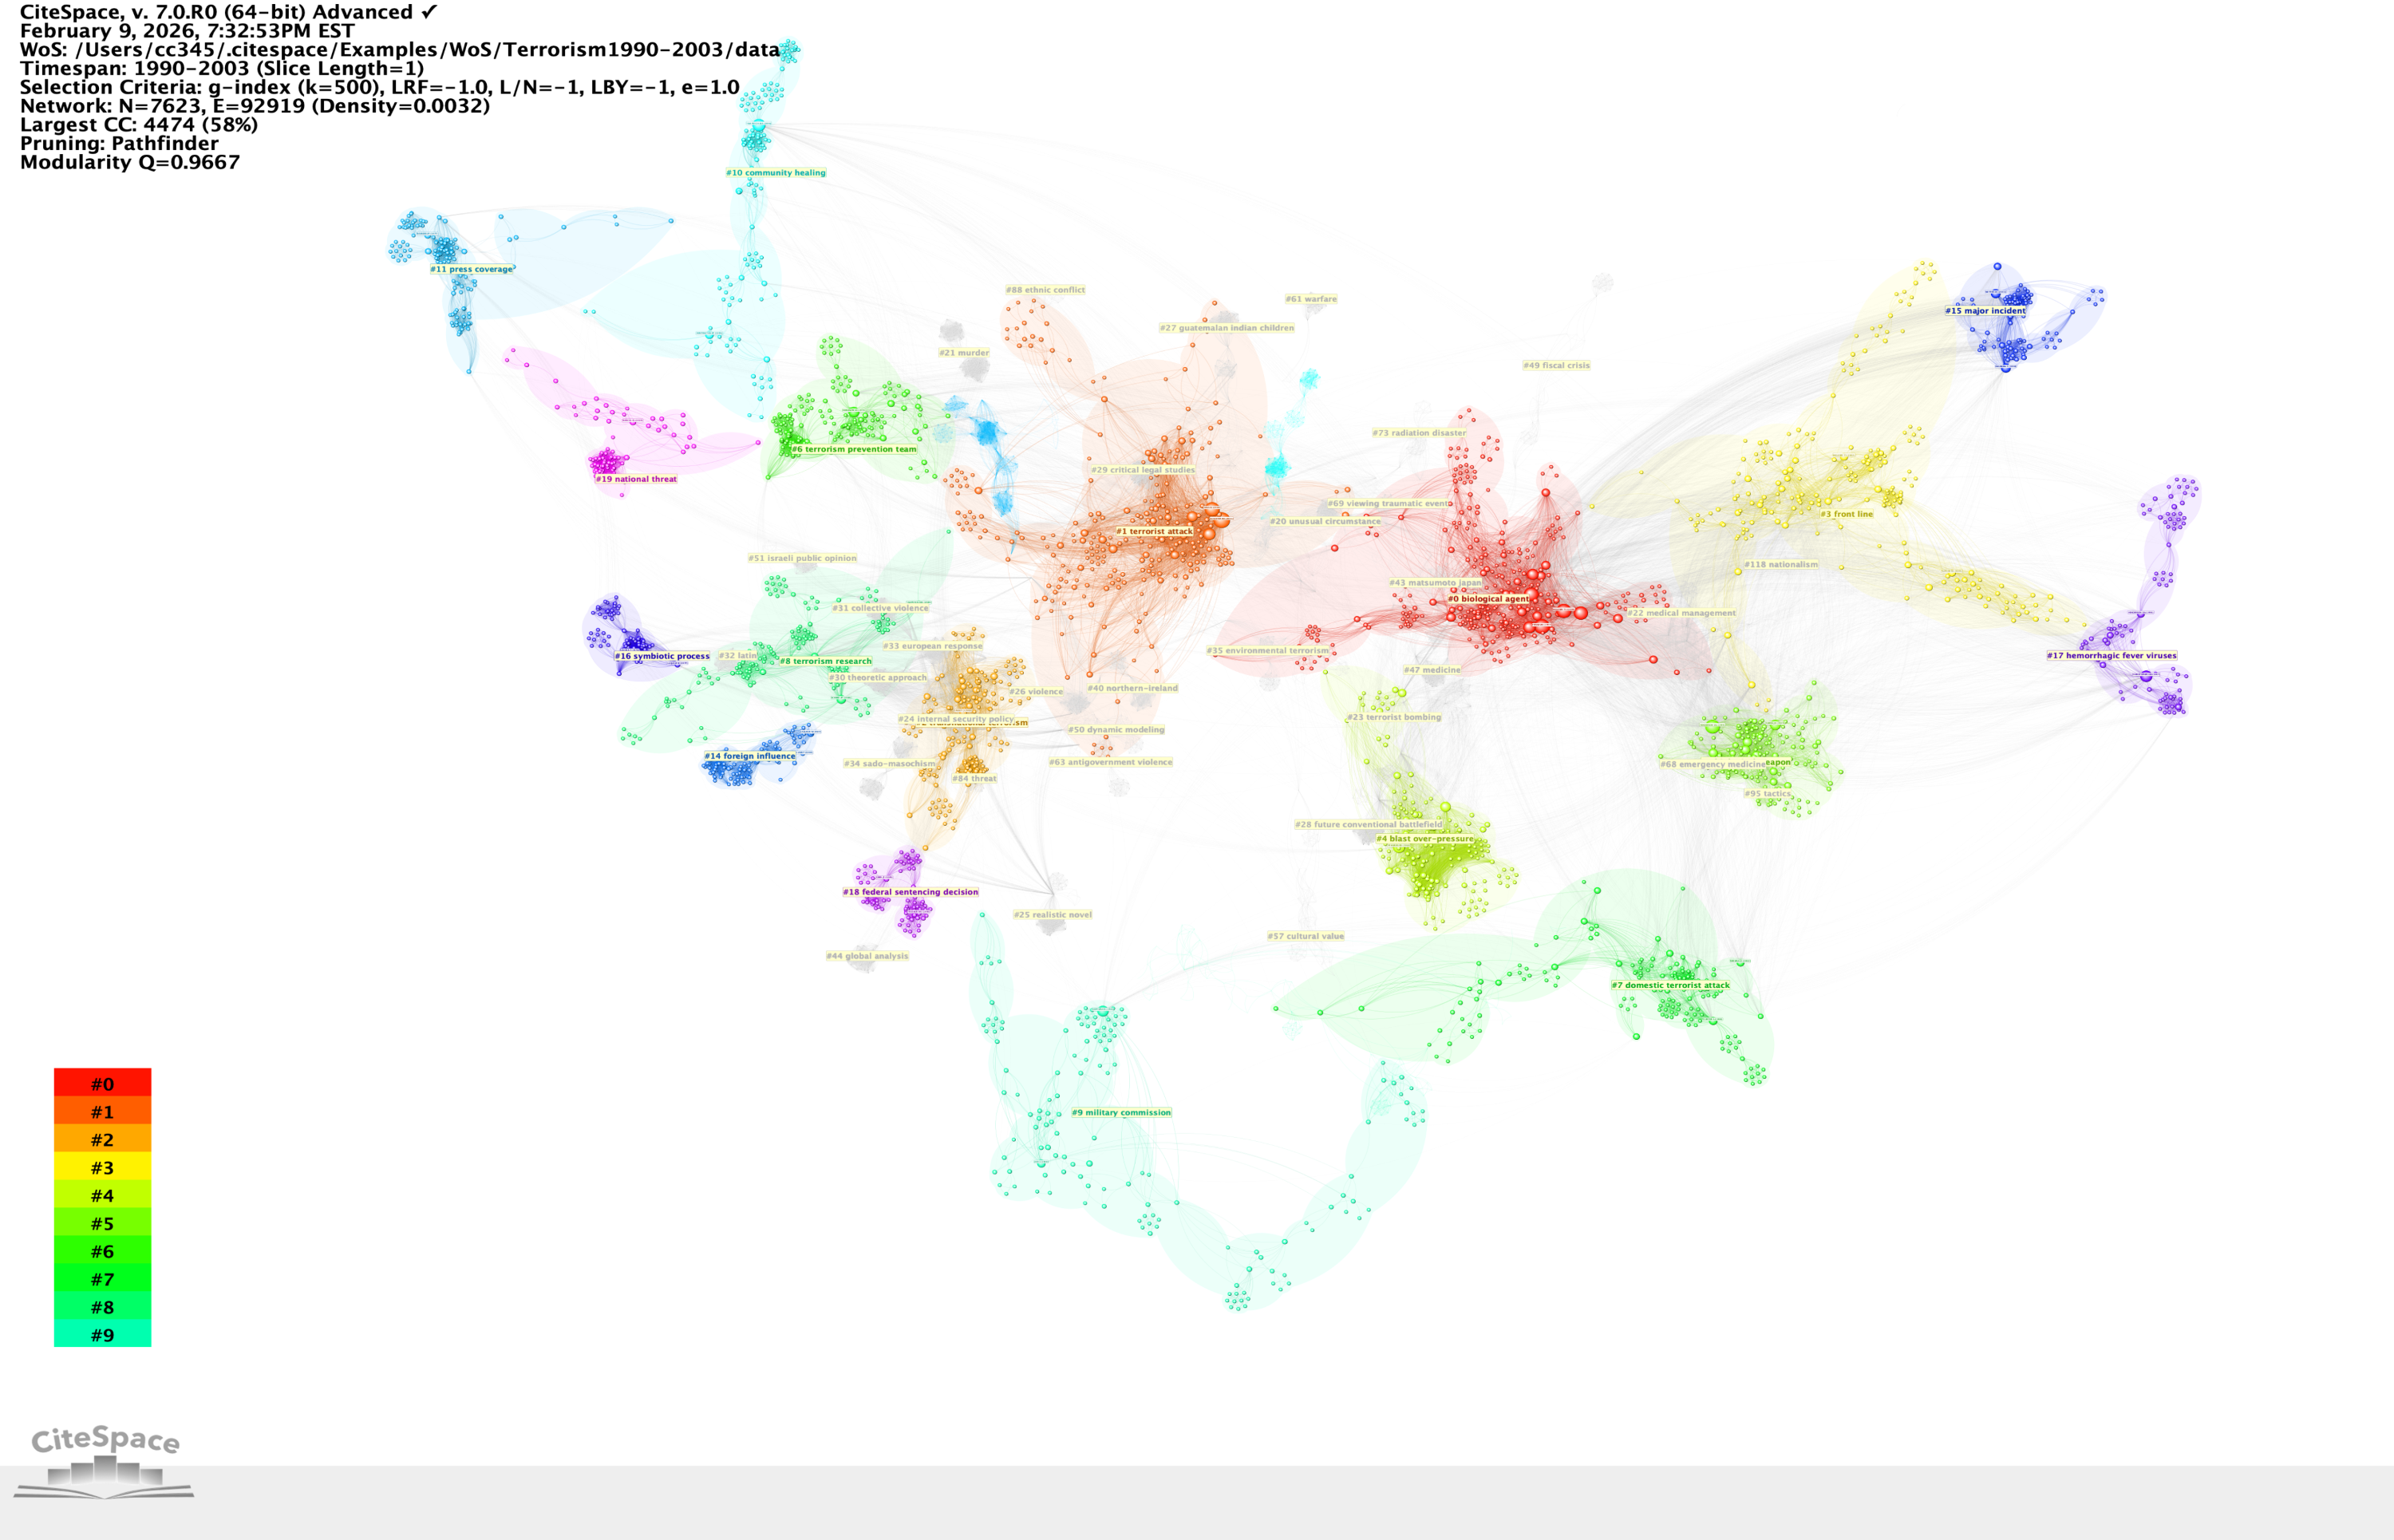
Here a black background is used to remind you the metaphorical galaxies and constellations that are far far away ...
2/2/2026 Update
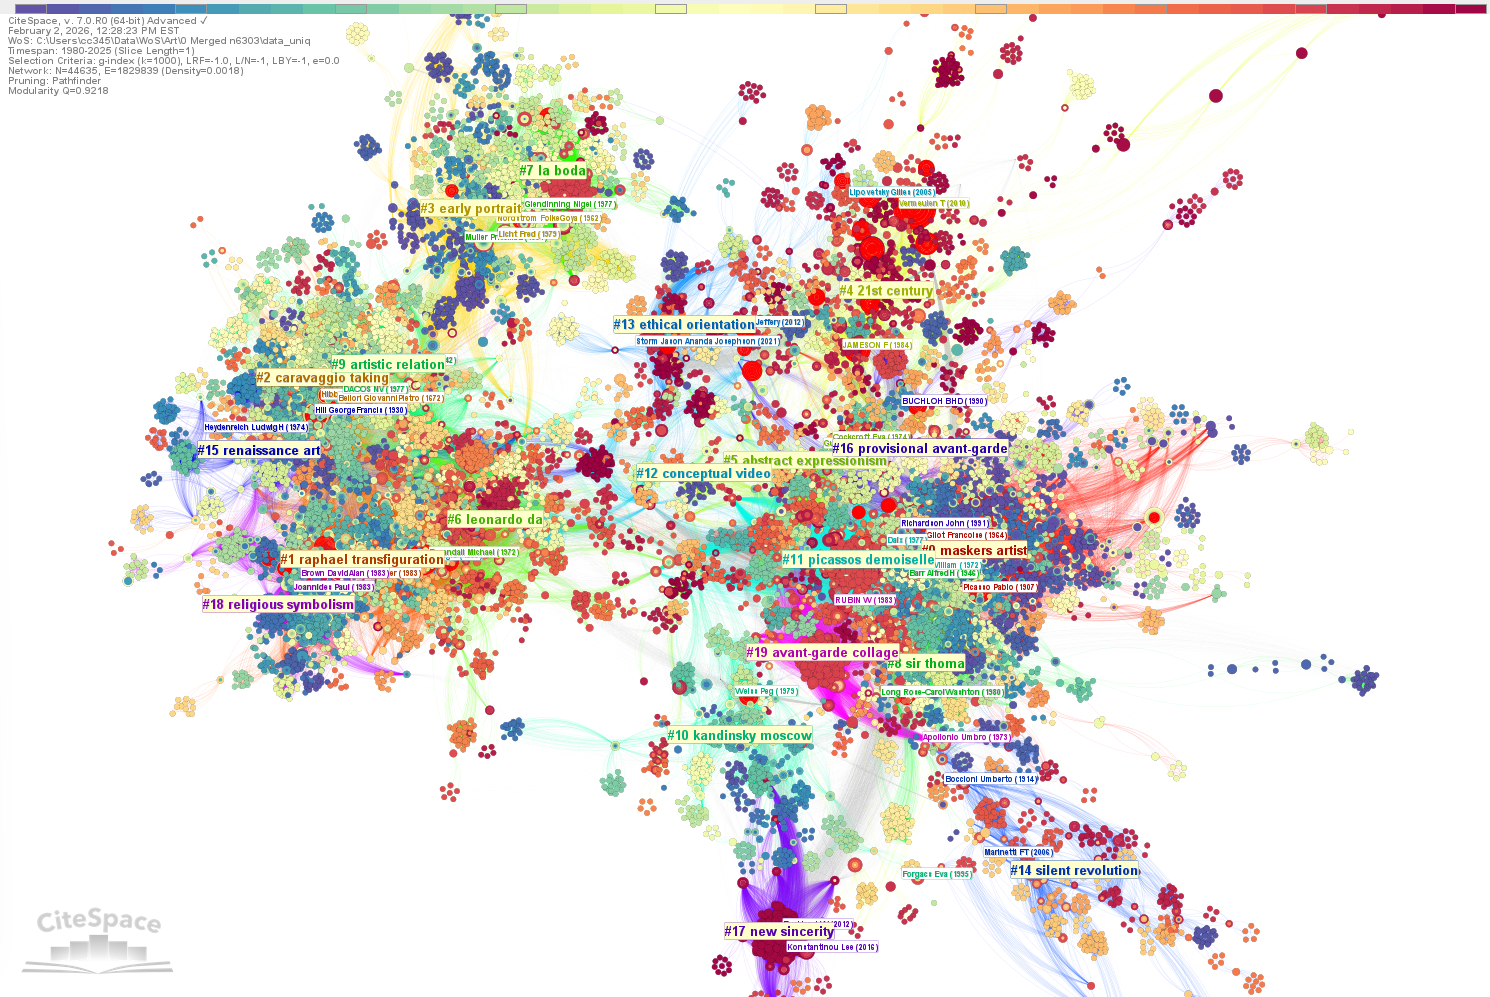
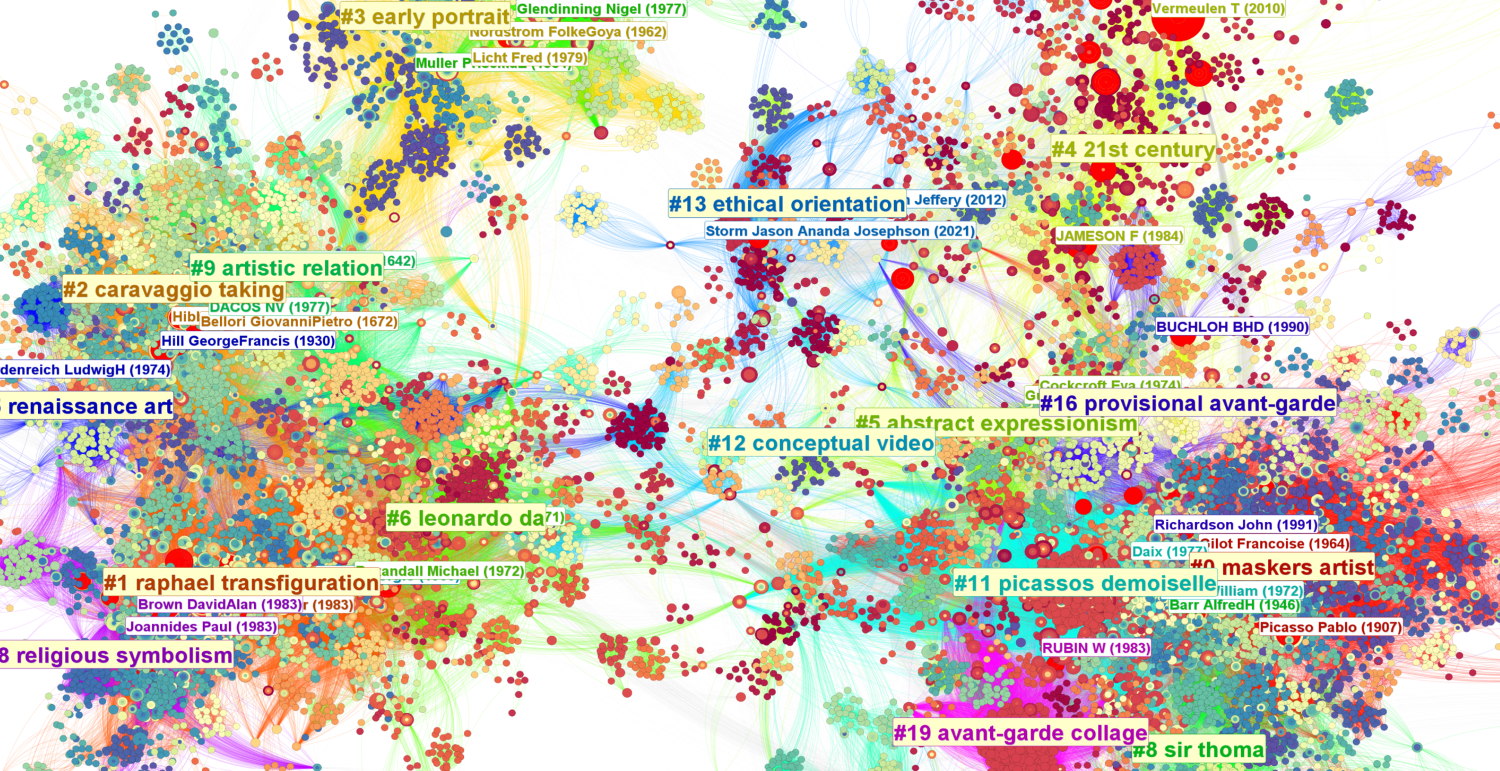
The new release includes a new generation of Pathfinder network scaling. It runs much faster and handles networks with millions of links. The following depicts a Pathfinder network of 44,635 nodes and 1,829,839 links. Its largest connected component consists of 33,784 nodes.
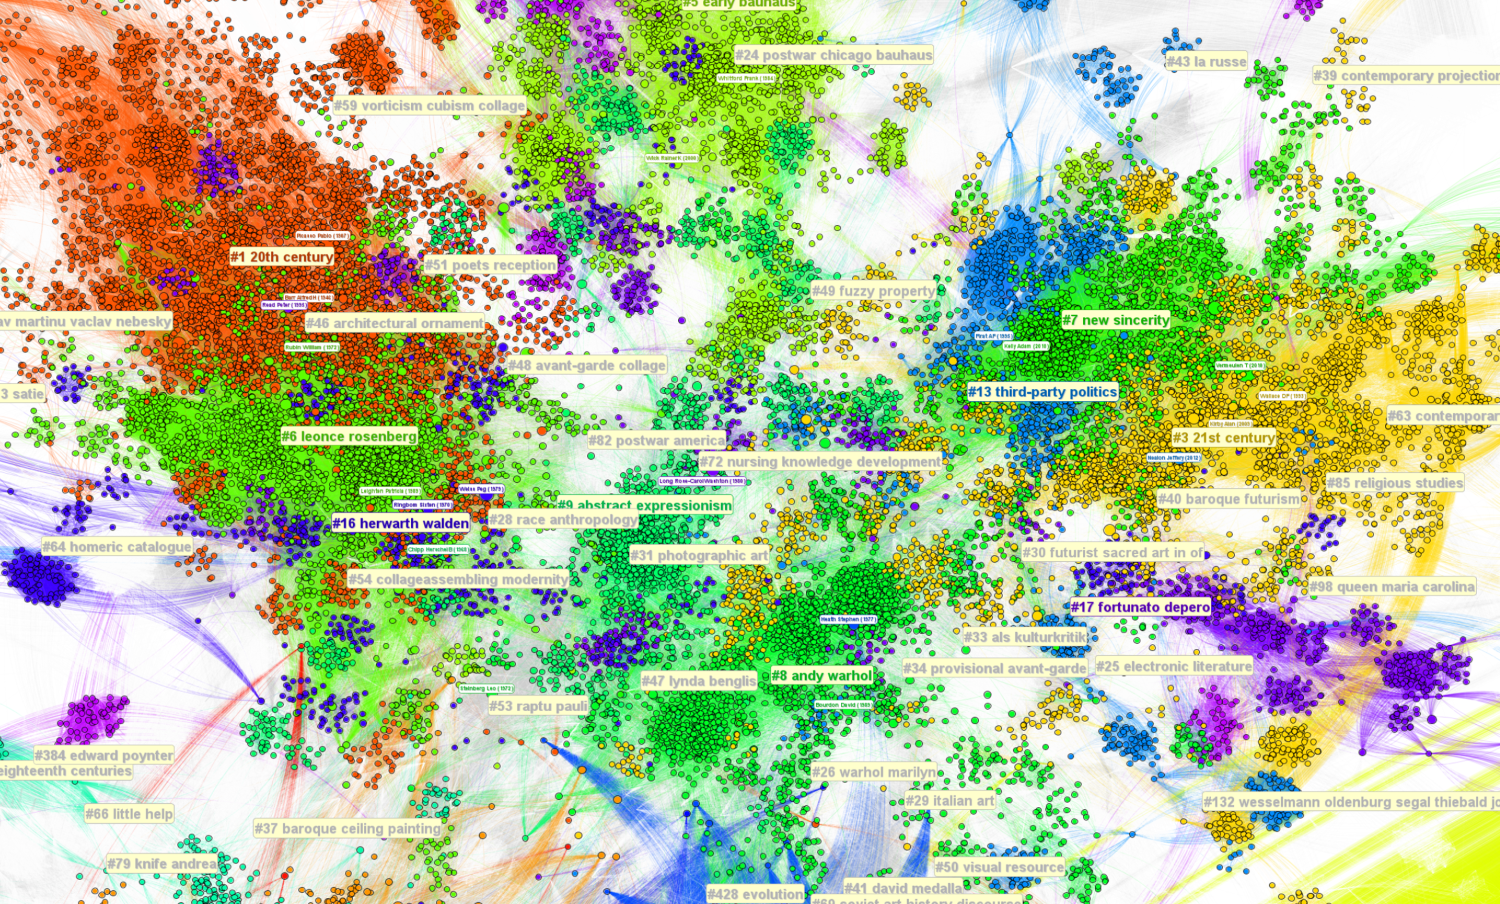
Below is part of a Pathfinder network with 100,169 nodes and over 7 million links (7,178,088).
Below is a hybrid network of citing authors, their institutions, countries, and keywords.
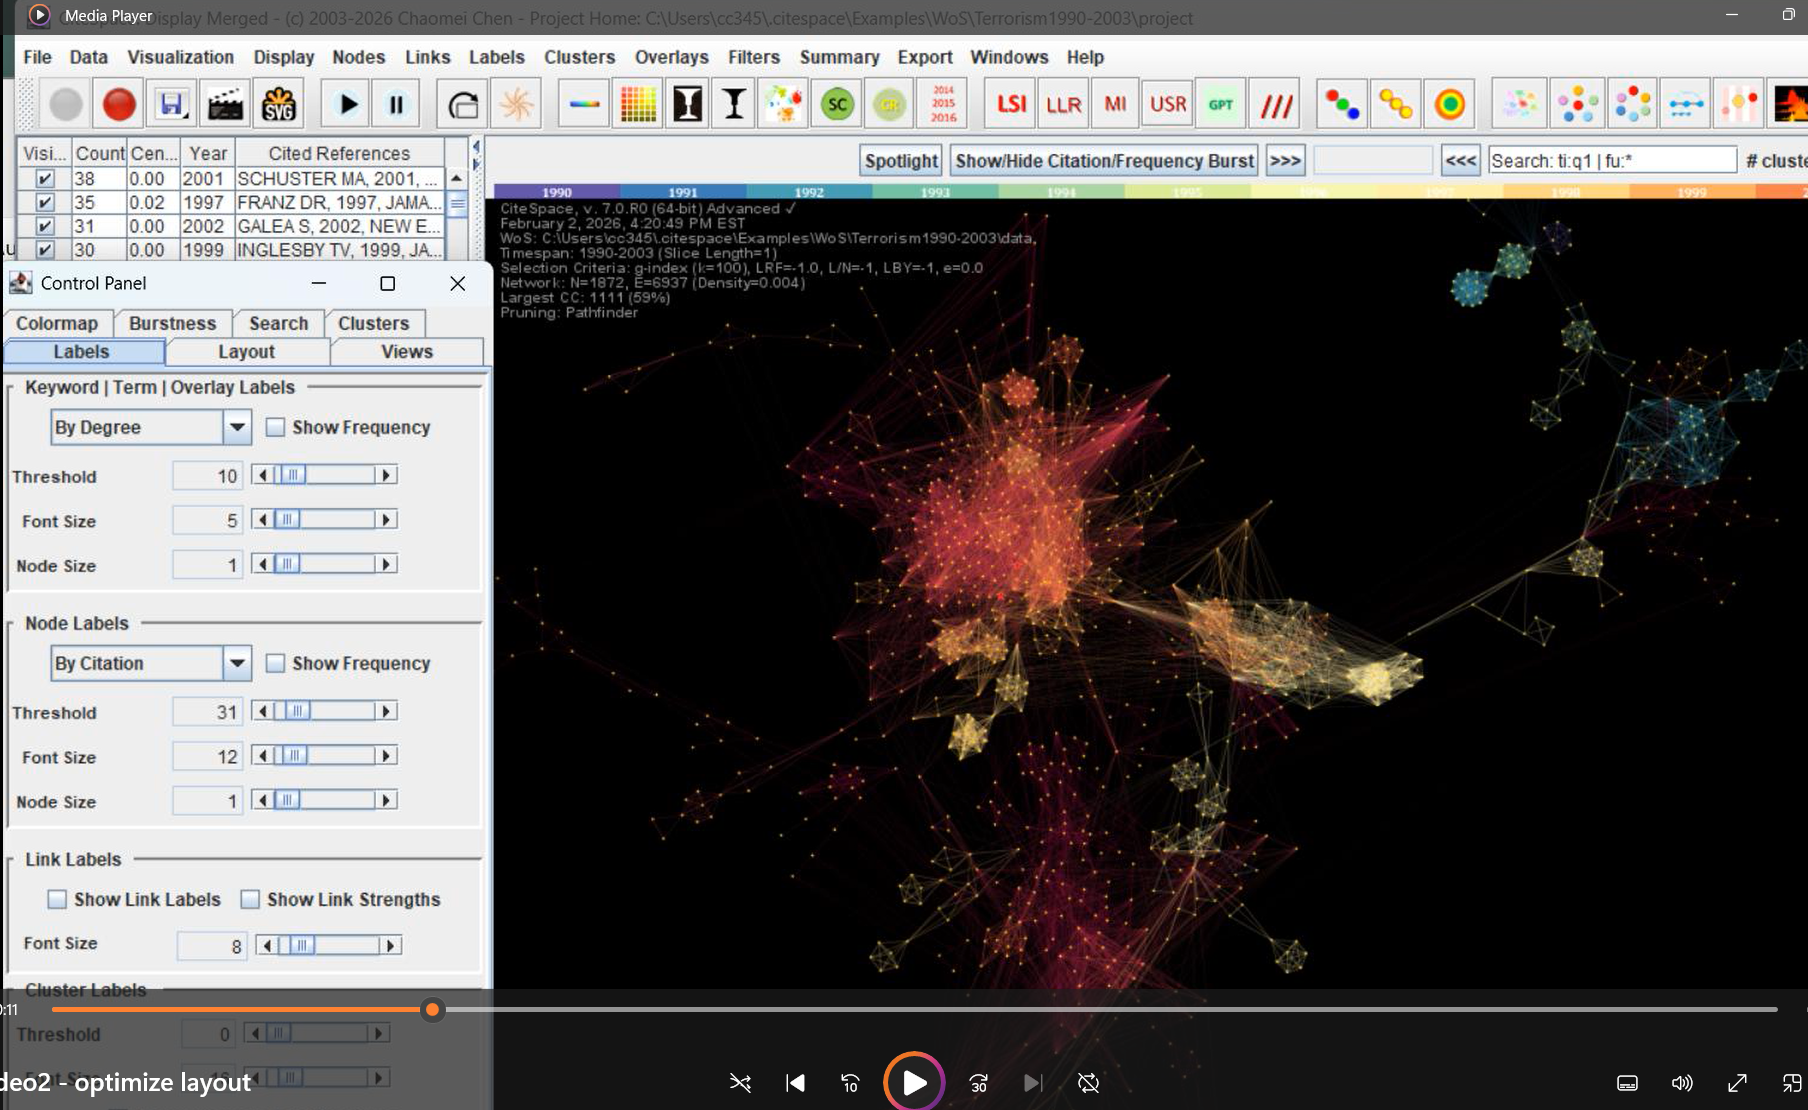
The new release has also restored an old feature - the screen recording function. You can record your screen using the two left-most round buttons. The recorded MOV files will be saved to your project folder as video1, video2, etc.
1/27/2026 Update
Another release on 1/27/2026 has restored SVA - Structural Variation Analysis along with some minor updates so that you can save files with Chinese as part of the filenames.
1/23/2026 Update
The new release with the built date of 1/23/2026 has restored treerings, bursts, and node frequency counts. This release replaces the previous 1/15/2026 release. If you are using the 1/15/2026, you should download the new release.
Nodes with citation bursts are shown with corresponding treerings in red. To make it easier to see red burst treerings, it is a good idea to choose the colormap that does not interfere with the red color.
Here is a closer view. You can see the treerings growing inside out.
Experimental Version
The current release covers features along the main visual analytic paths. It enables you visualize a network, summarize its key clusters, and generate a summary report. It is most likely that it will be replaced by newer versions well before its expiration date at the end of 2027, about two years from now. On the other hand, if you prefer stability, you can certainly keep using it till its expiration. Just bear in mind that a few functions are still on their way, including burst detection and possibly an updated Scopus converter.
Optimized Performance
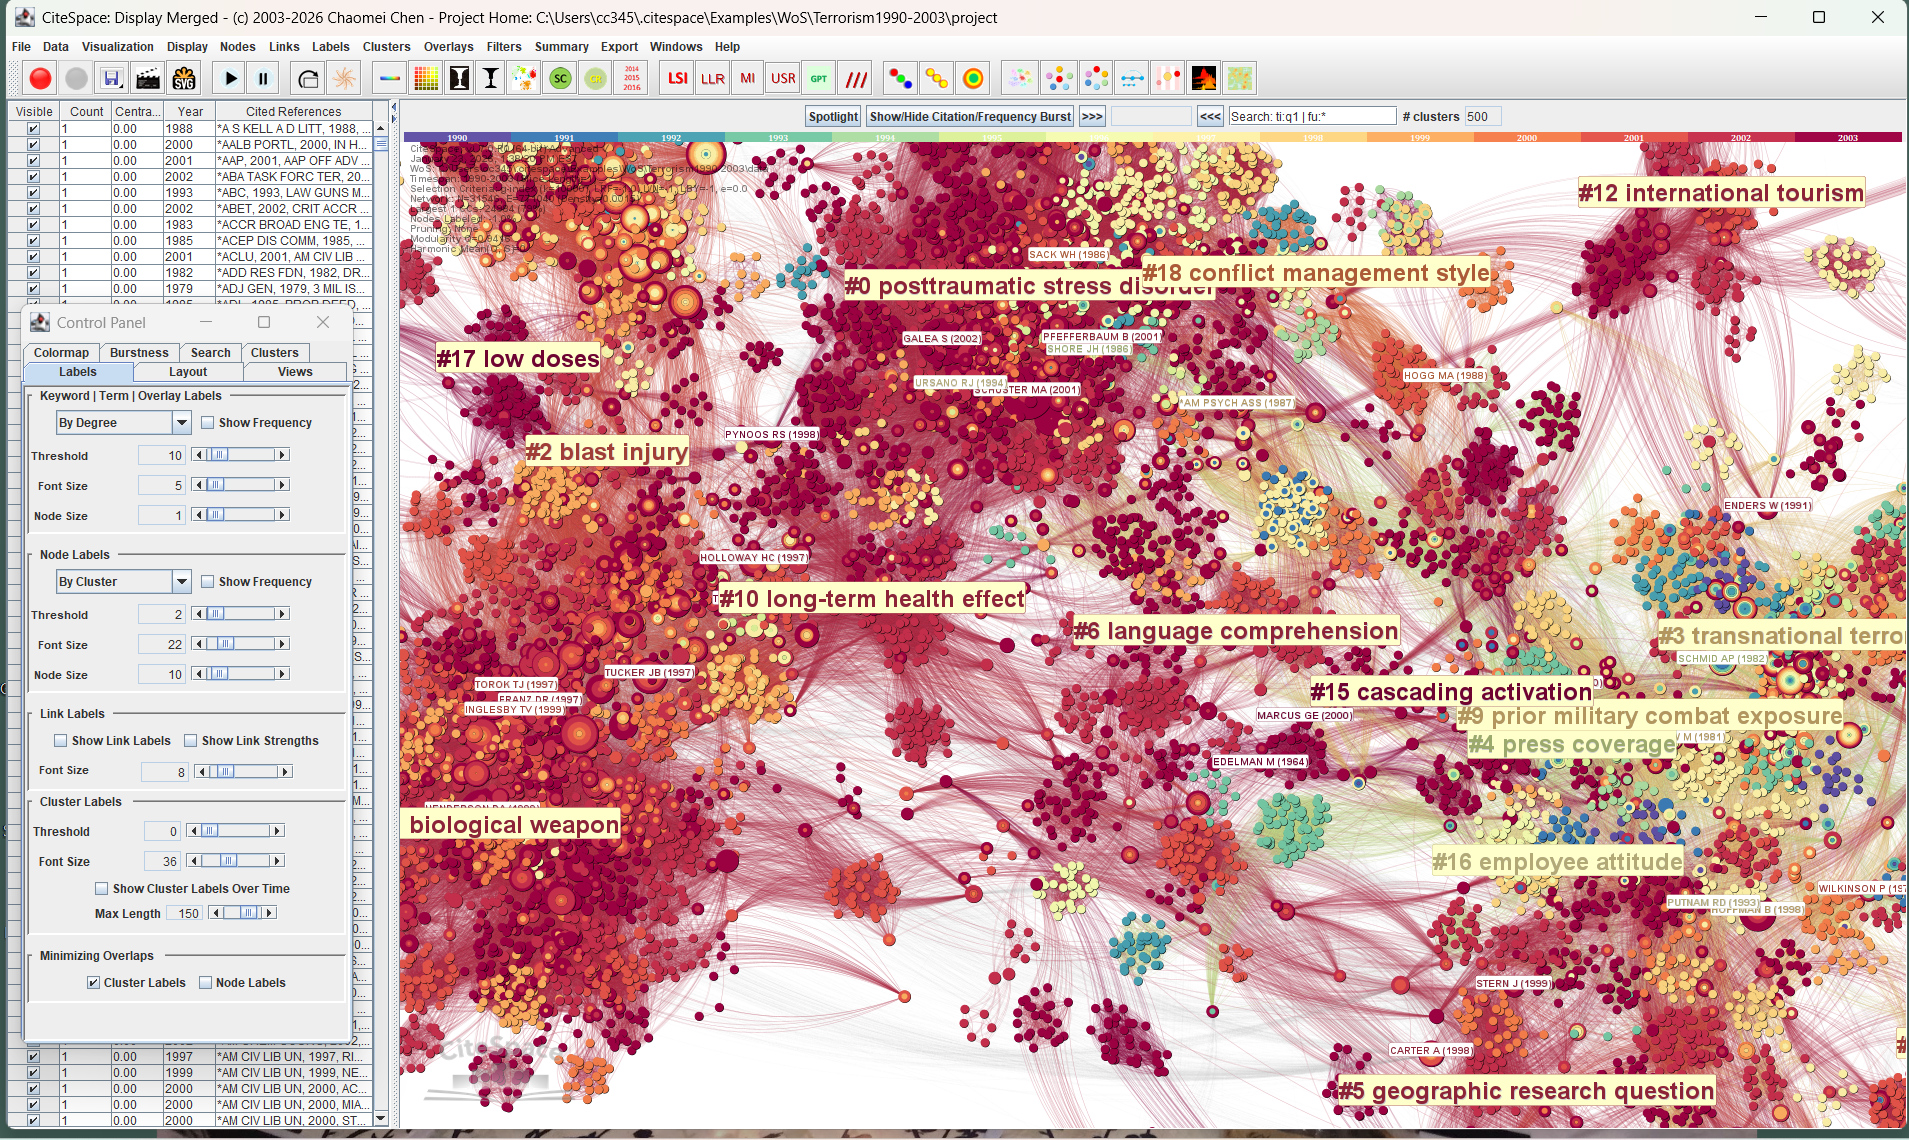
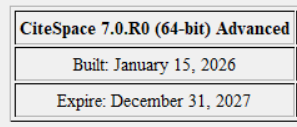
The new version optimized the overall performance. In particular, it allows you to handle much larger networks than previous versions. In the following example, nodes are selected by g-index with a k of 10,000. The network in this example consists of 100,168 nodes and 131,845 links. It took 1 minute 9 seconds to complete the construction.
The new version is also leaner with various optimizations of its internal efficiency. The size of its installer is reduced to 35.4MB from the 36.2MB installer of 6.4.2.
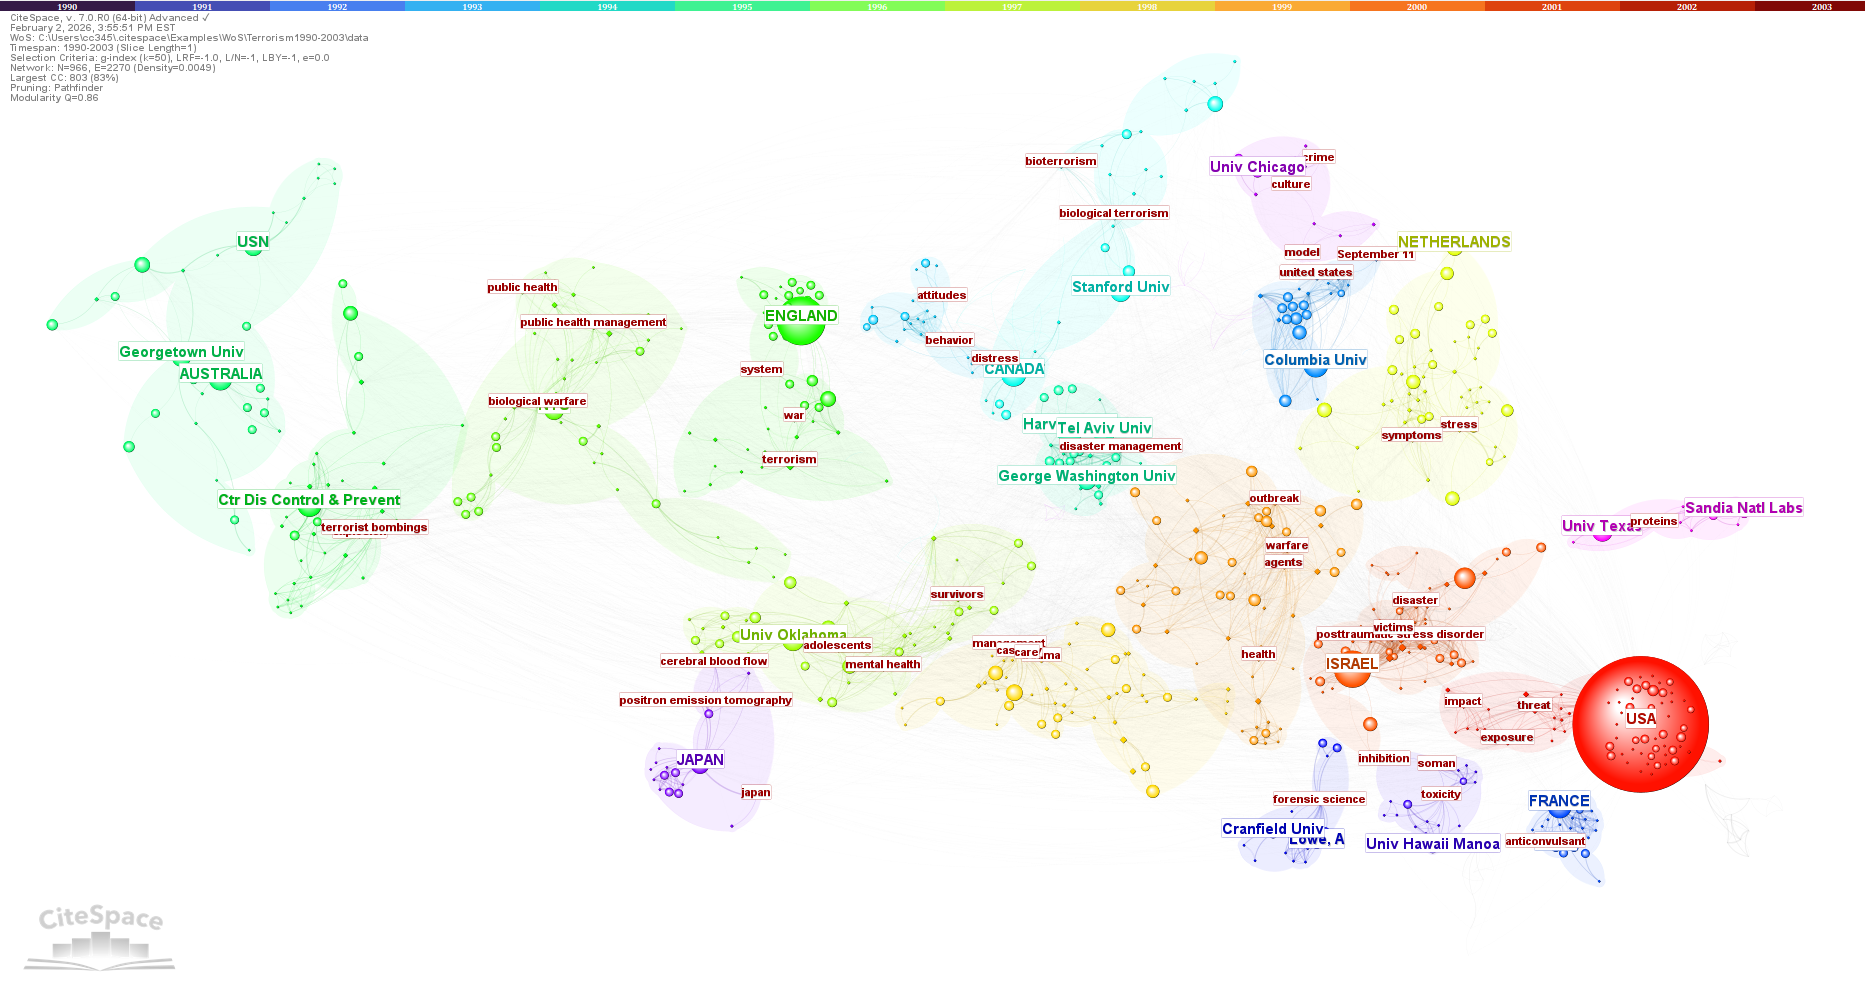
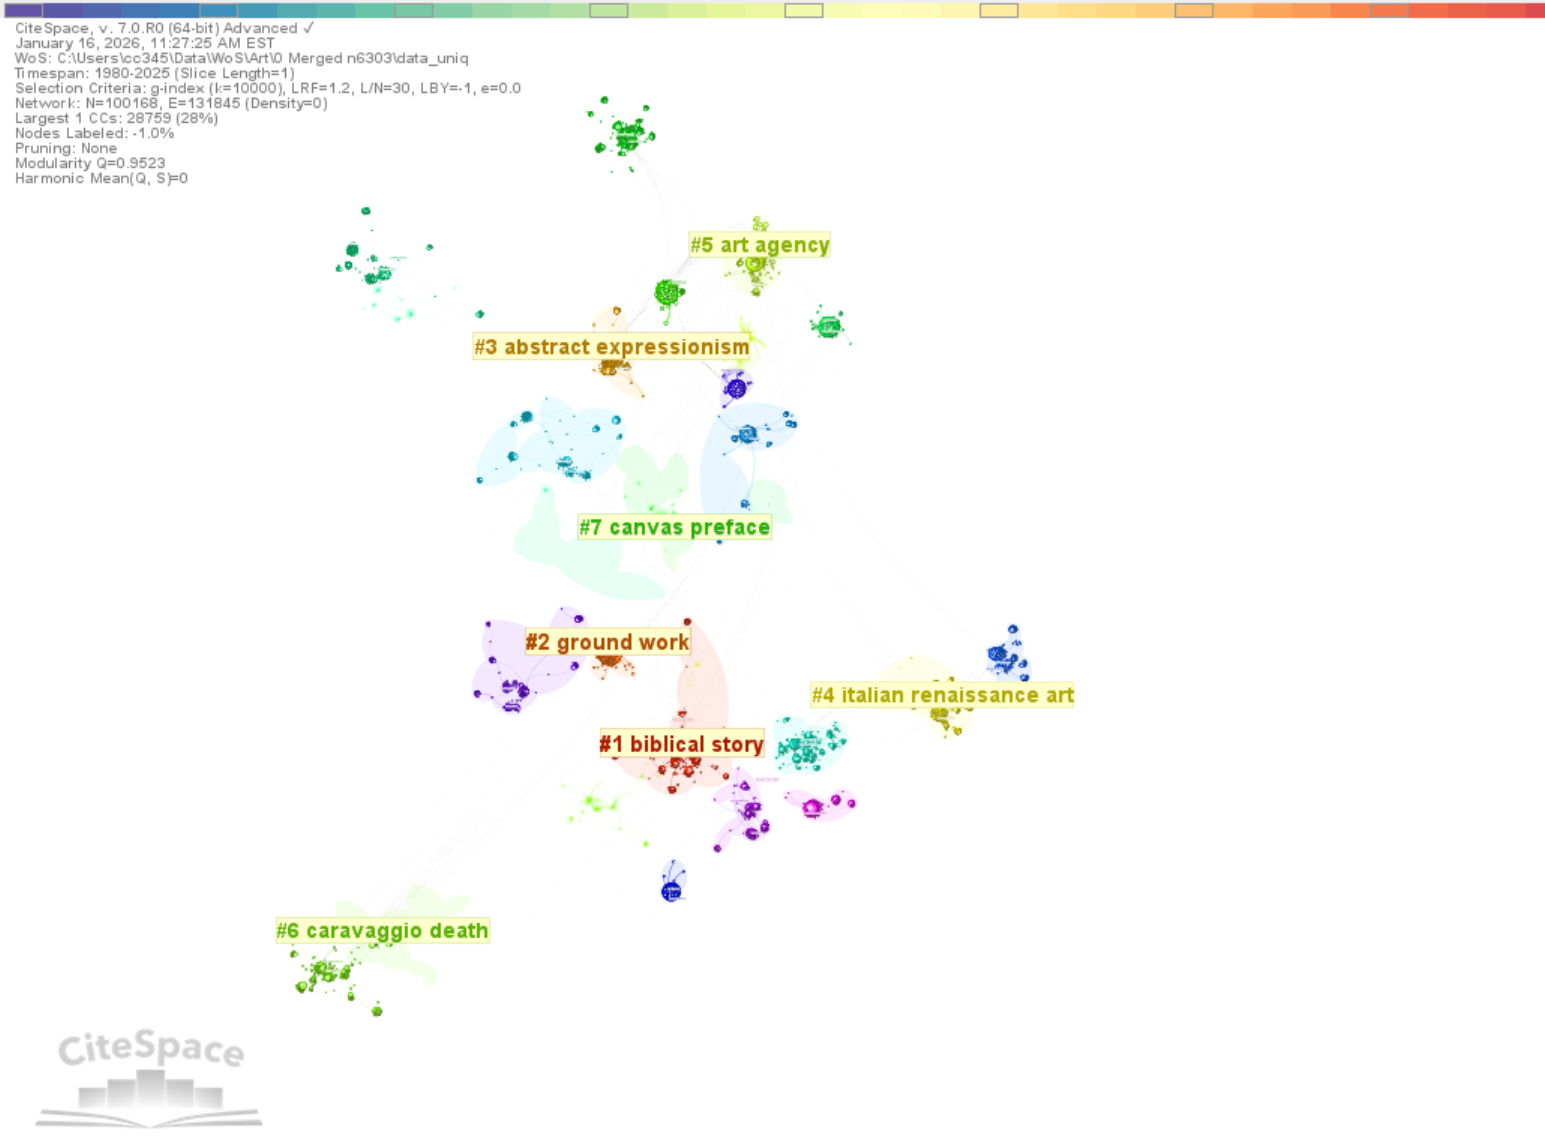
There are two ways to cluster the network. Using the All-in-One function is recommended. The other is menu-based from the Clustering selection under the Clusters menu. The latter preserves the layout despite some clusters may considerably overlap with each other. The visualization below was generated with the latter approach; the display depicts 28,759 nodes in the largest connected component of the 100,000+ node network.
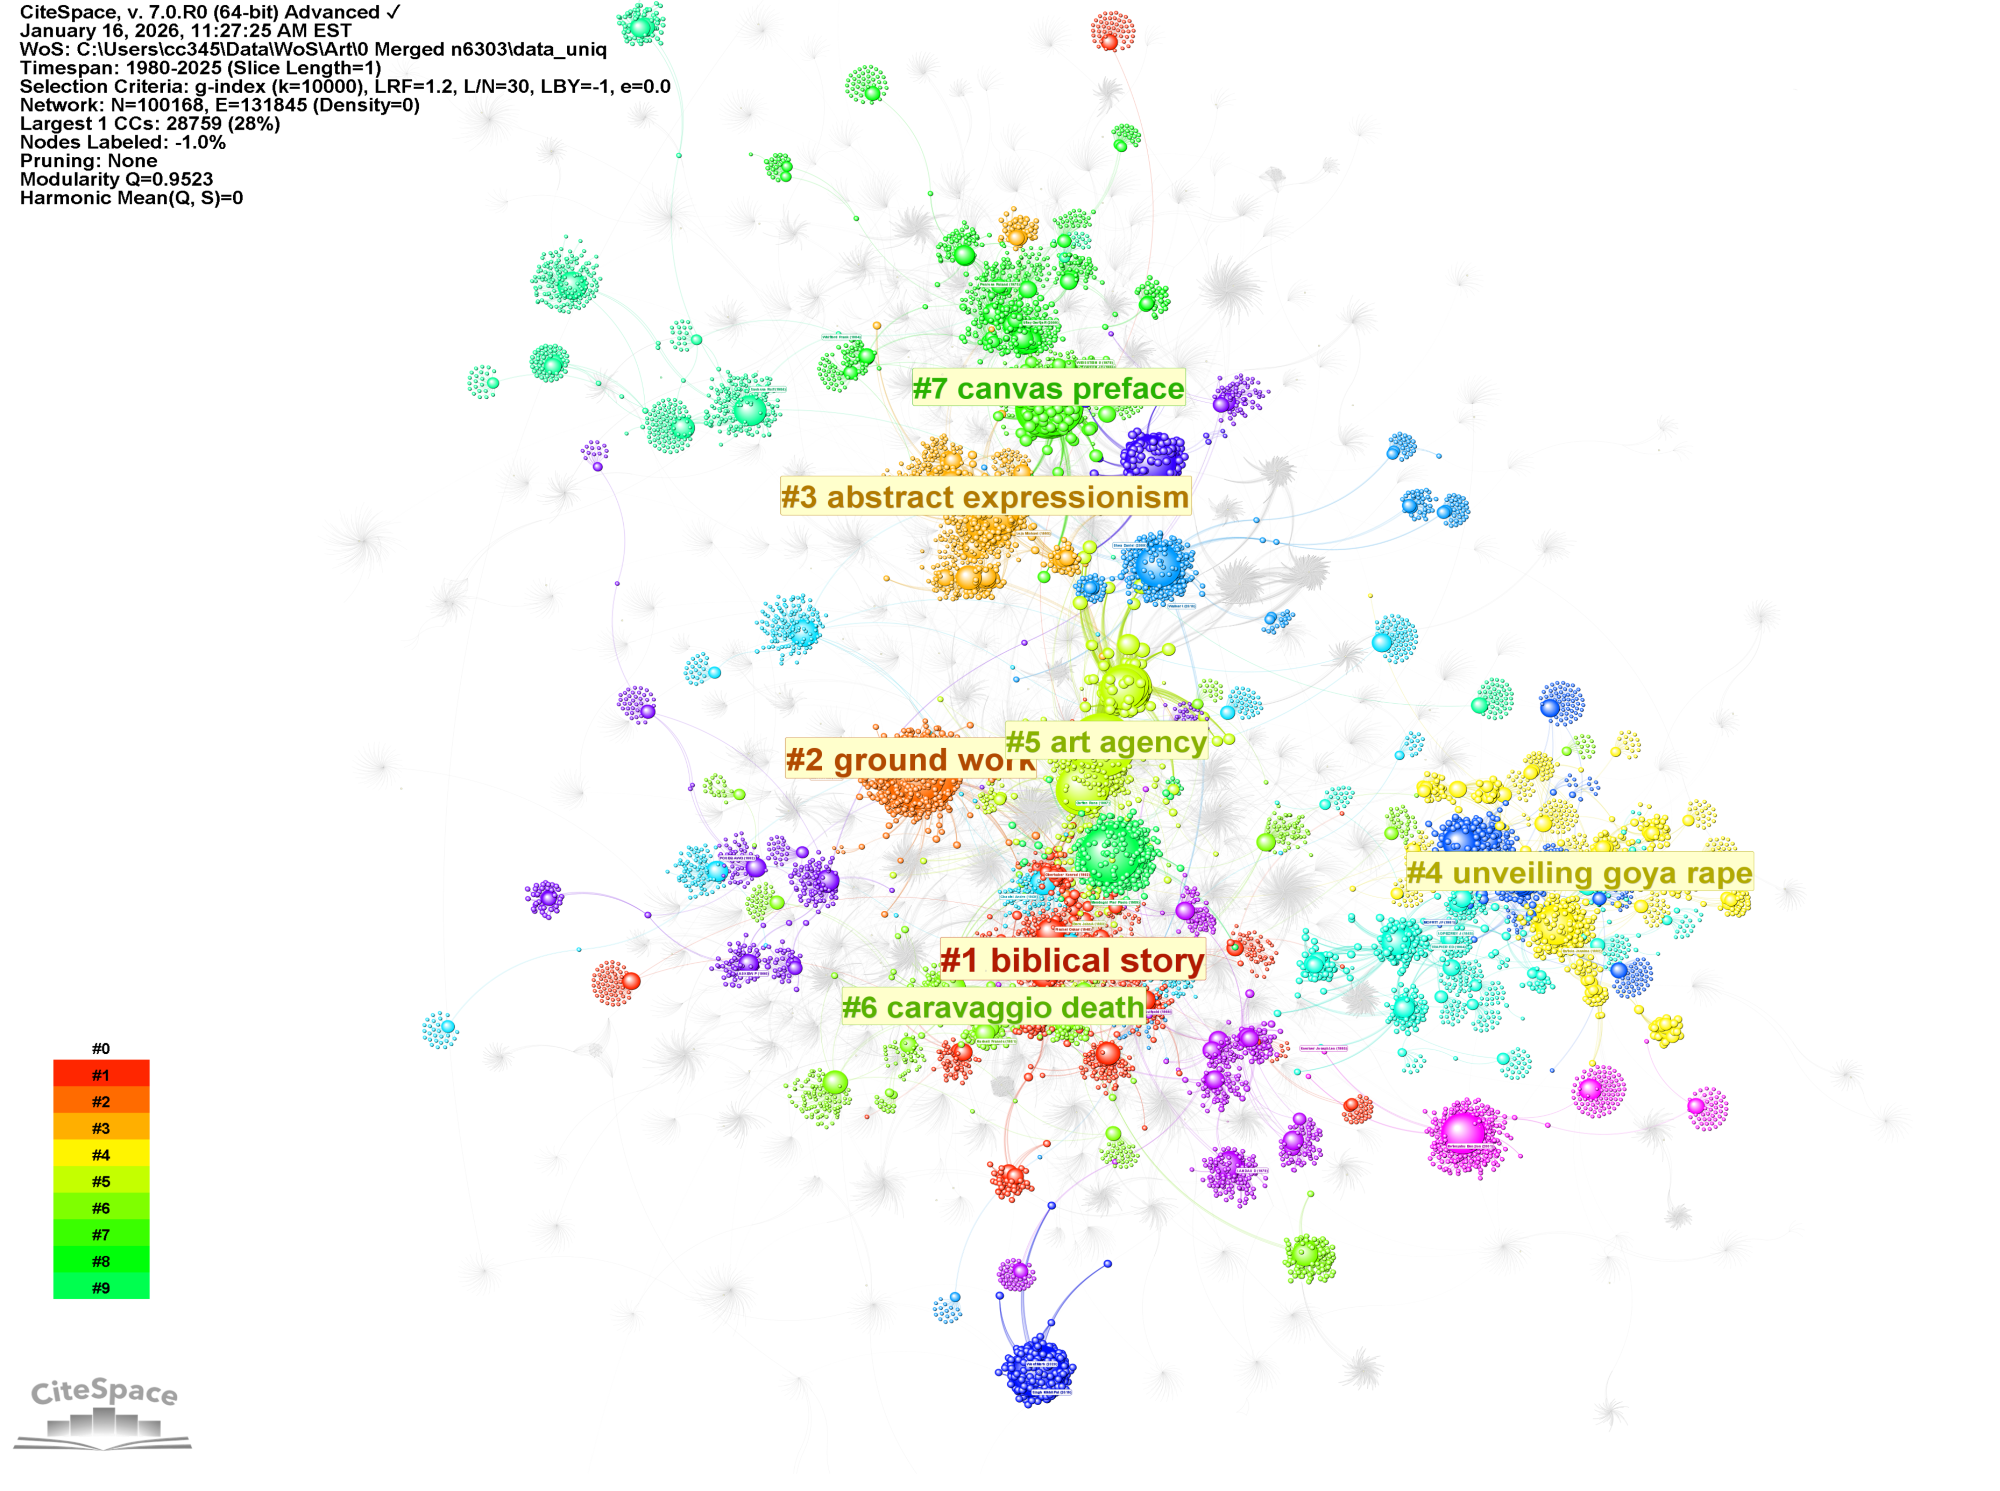
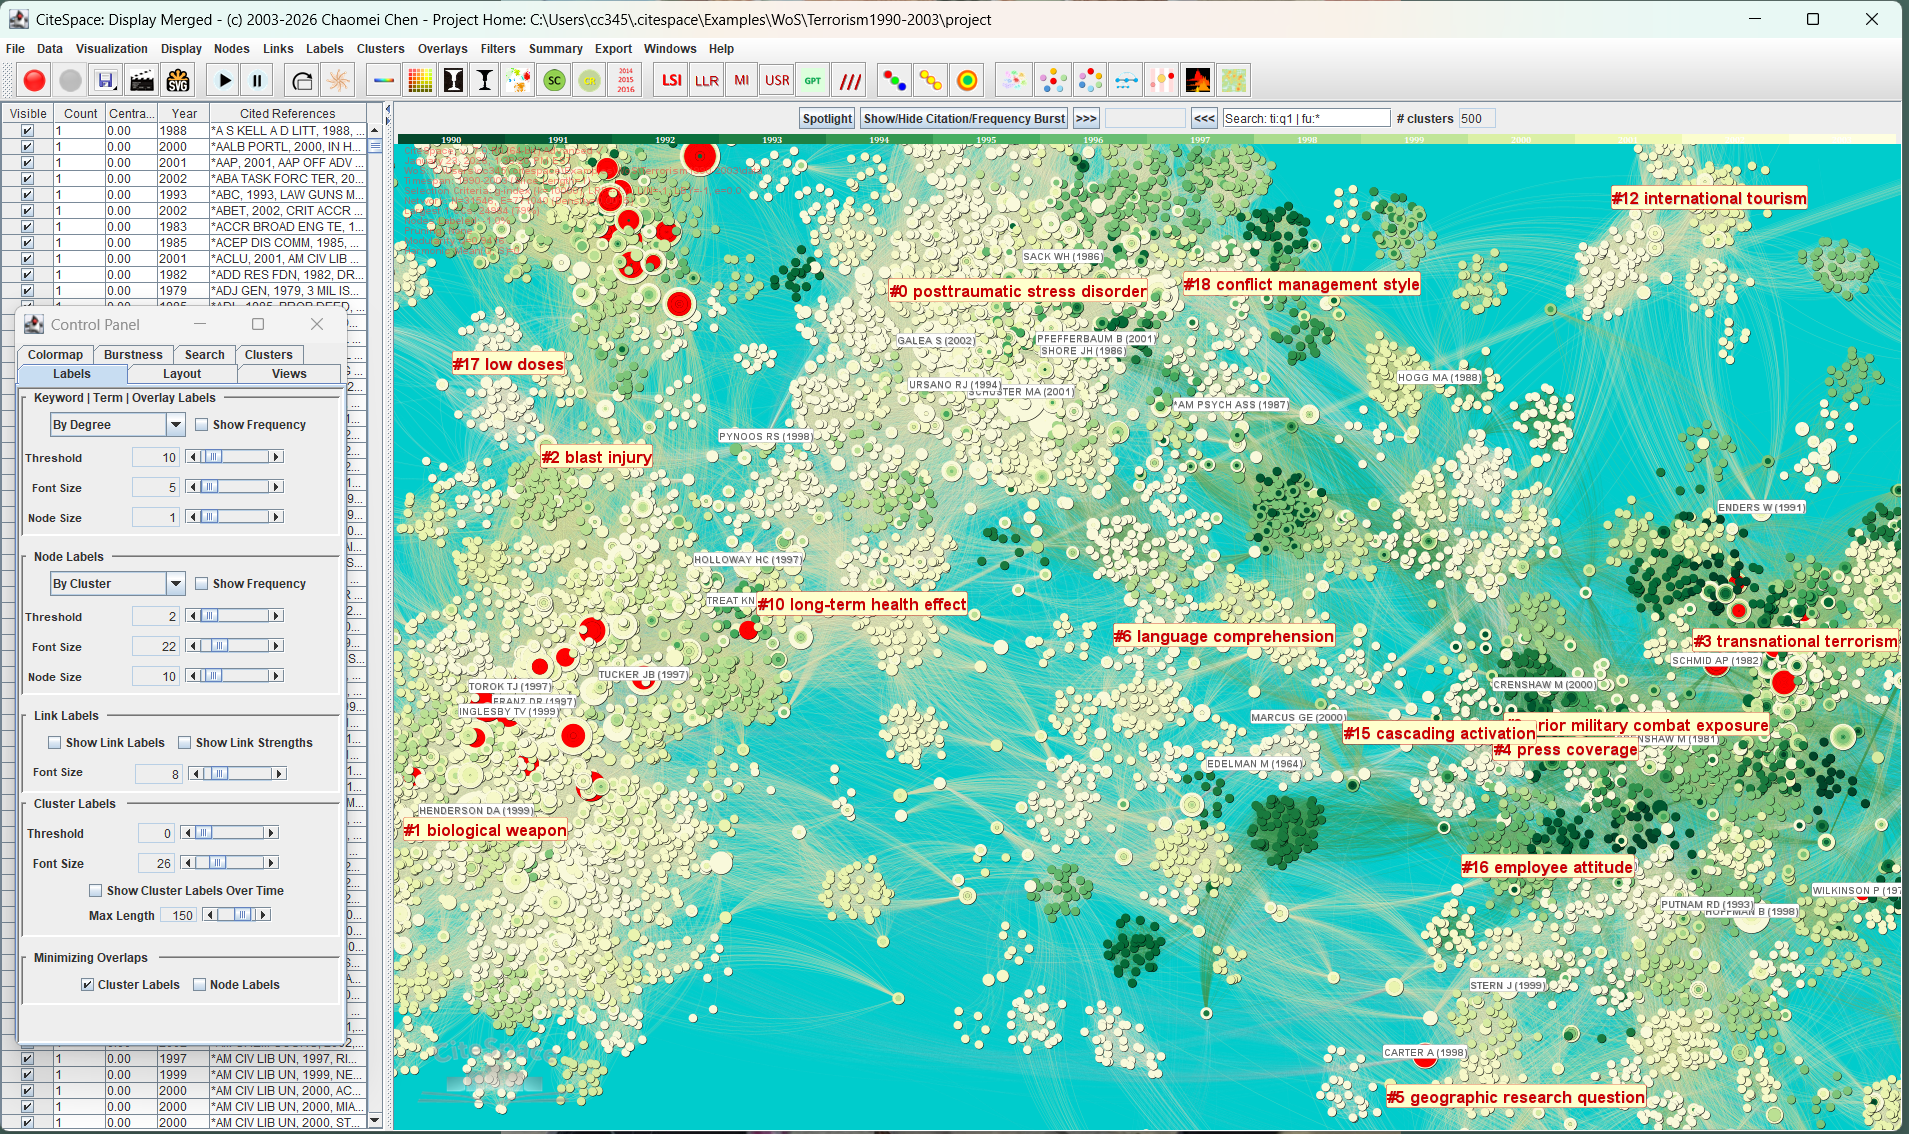
The visualization below was generated with the All-in-One and followed by the Layout Optimization. This is the same network. The optimized layout improves the clarity of the overall structure.
Cluster Summarization: Updated
The Cluster Summarization function is updated to OpenAI's gpt-5-mini (default) and gpt-5.2. The new version has also enabled the API from deekseek.
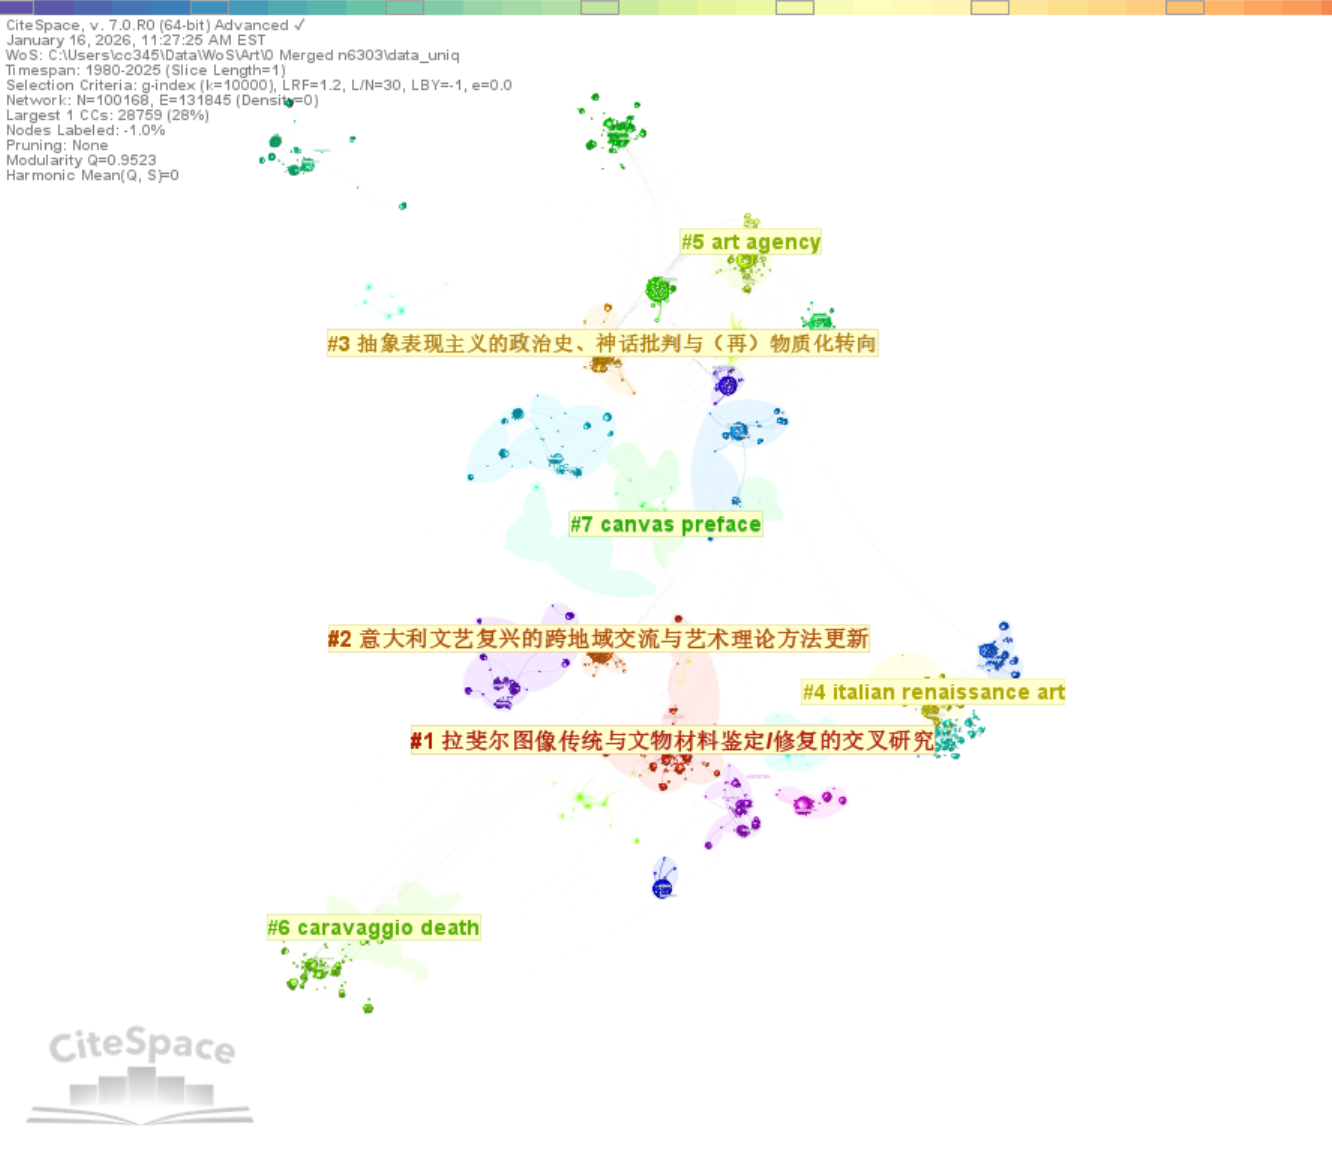
The following example illustrates the results using Chinese as the summarization language.
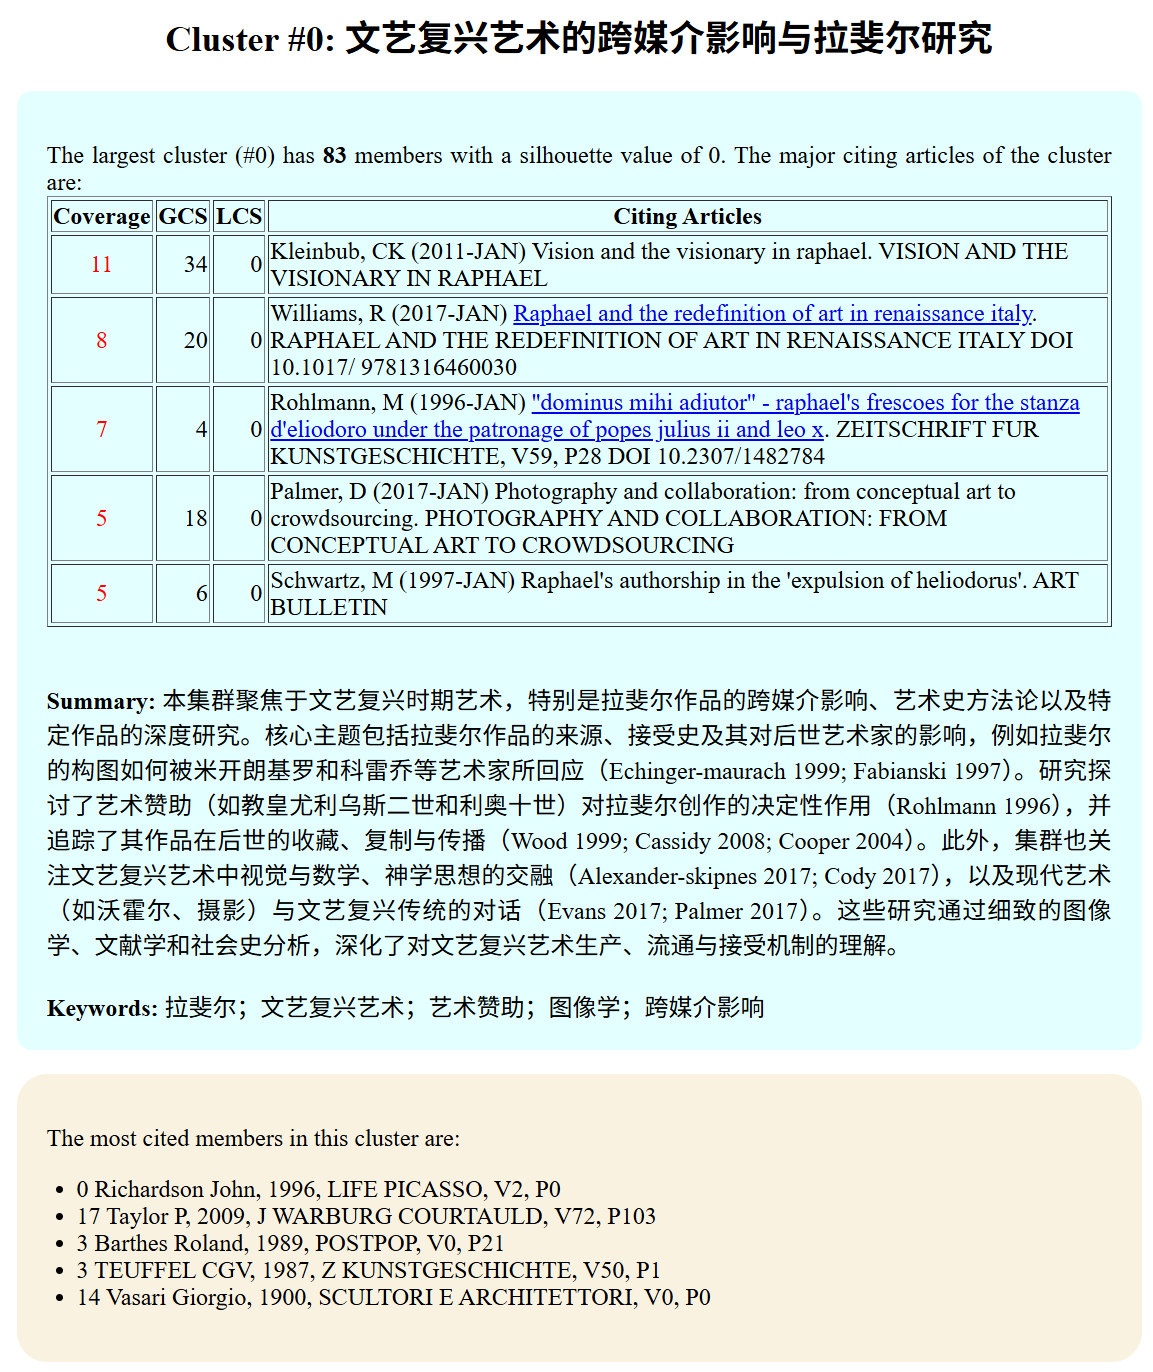
Once the cluster summarization is completed, you can use the Summary Report function to inspect major clusters in terms of what they are about, key contextual information such as major citing works, and the most frequently cited works as the intellectual basis of the cluster. Major themes in each cluster are highlighted and synthesized along with the most representative citing articles.
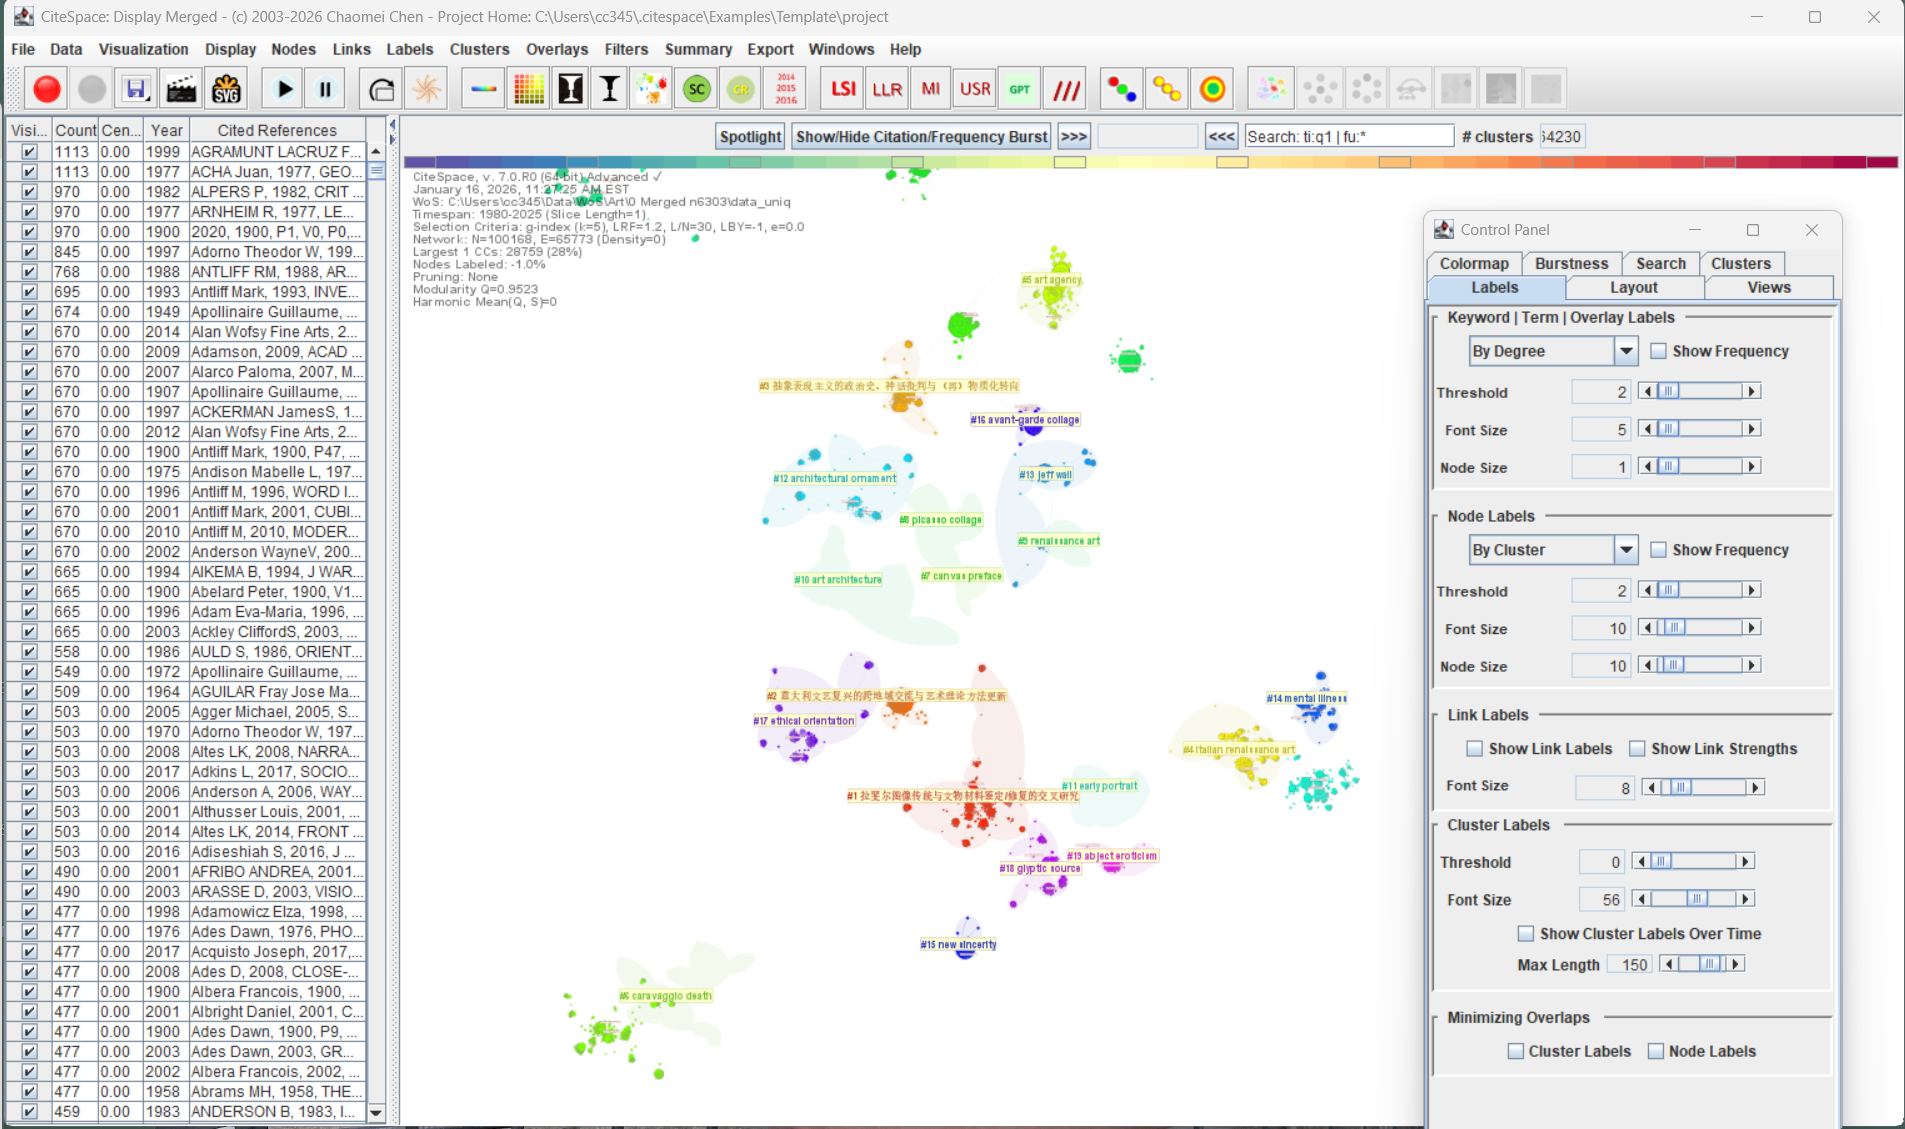
Save and Re-open Visualization
The current visualization can be saved and reopened. The screen shot below depicts a previously saved visualization reopened. Note that some of the features on the right end of the tool bars are not available as they would require more data if you simply pass the saved visualization file.
Features Under Construction
A few features are temporarily not available with the new release, including burst detection. The current Scopus converter may need to be updated due to Scopus' recent change of its CSV export format. It moves away from the previous all-author reference format to the first-author only format. Once it is clear which direction Scopus wants to go, I will update the converter accordingly.
Please leave your feedback and comments with the blog. They will be certainly taken into consideration.