- Nov 26, 2024
Exploring Clusters with Year-By-Year Labels
- Chaomei Chen
- 0 comments
Most clusters evolve over multiple years. A single label can only capture the most salient aspect of a cluster. We can use the year-by-year labeling function in CiteSpace to further explore the dynamics of a cluster at a more detailed level.
I will illustrate the use with a dataset on Information Visualization and Visual Analytics. Generate clusters with the All-in-One function.
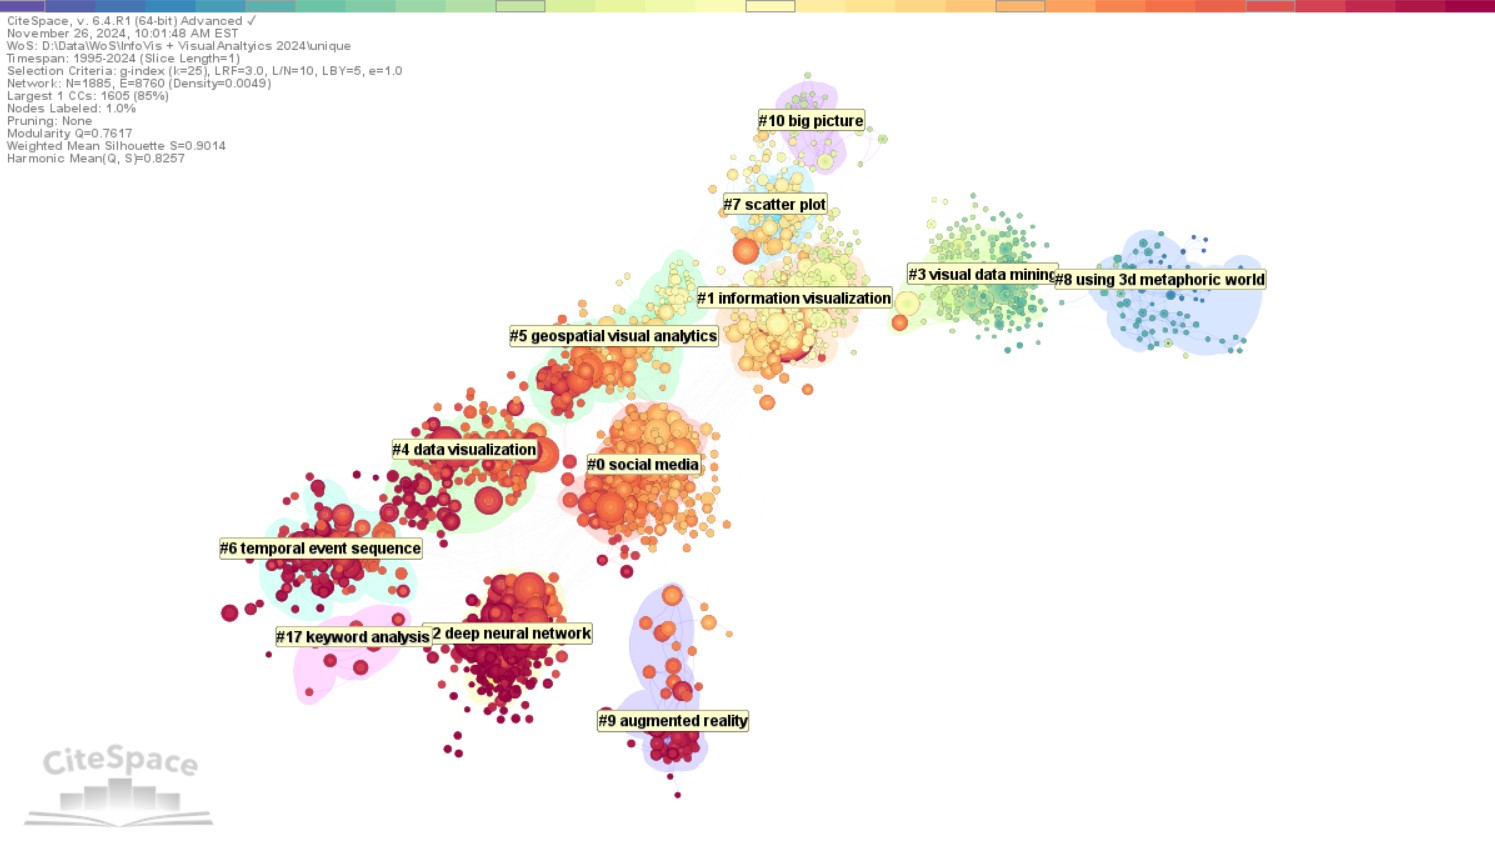
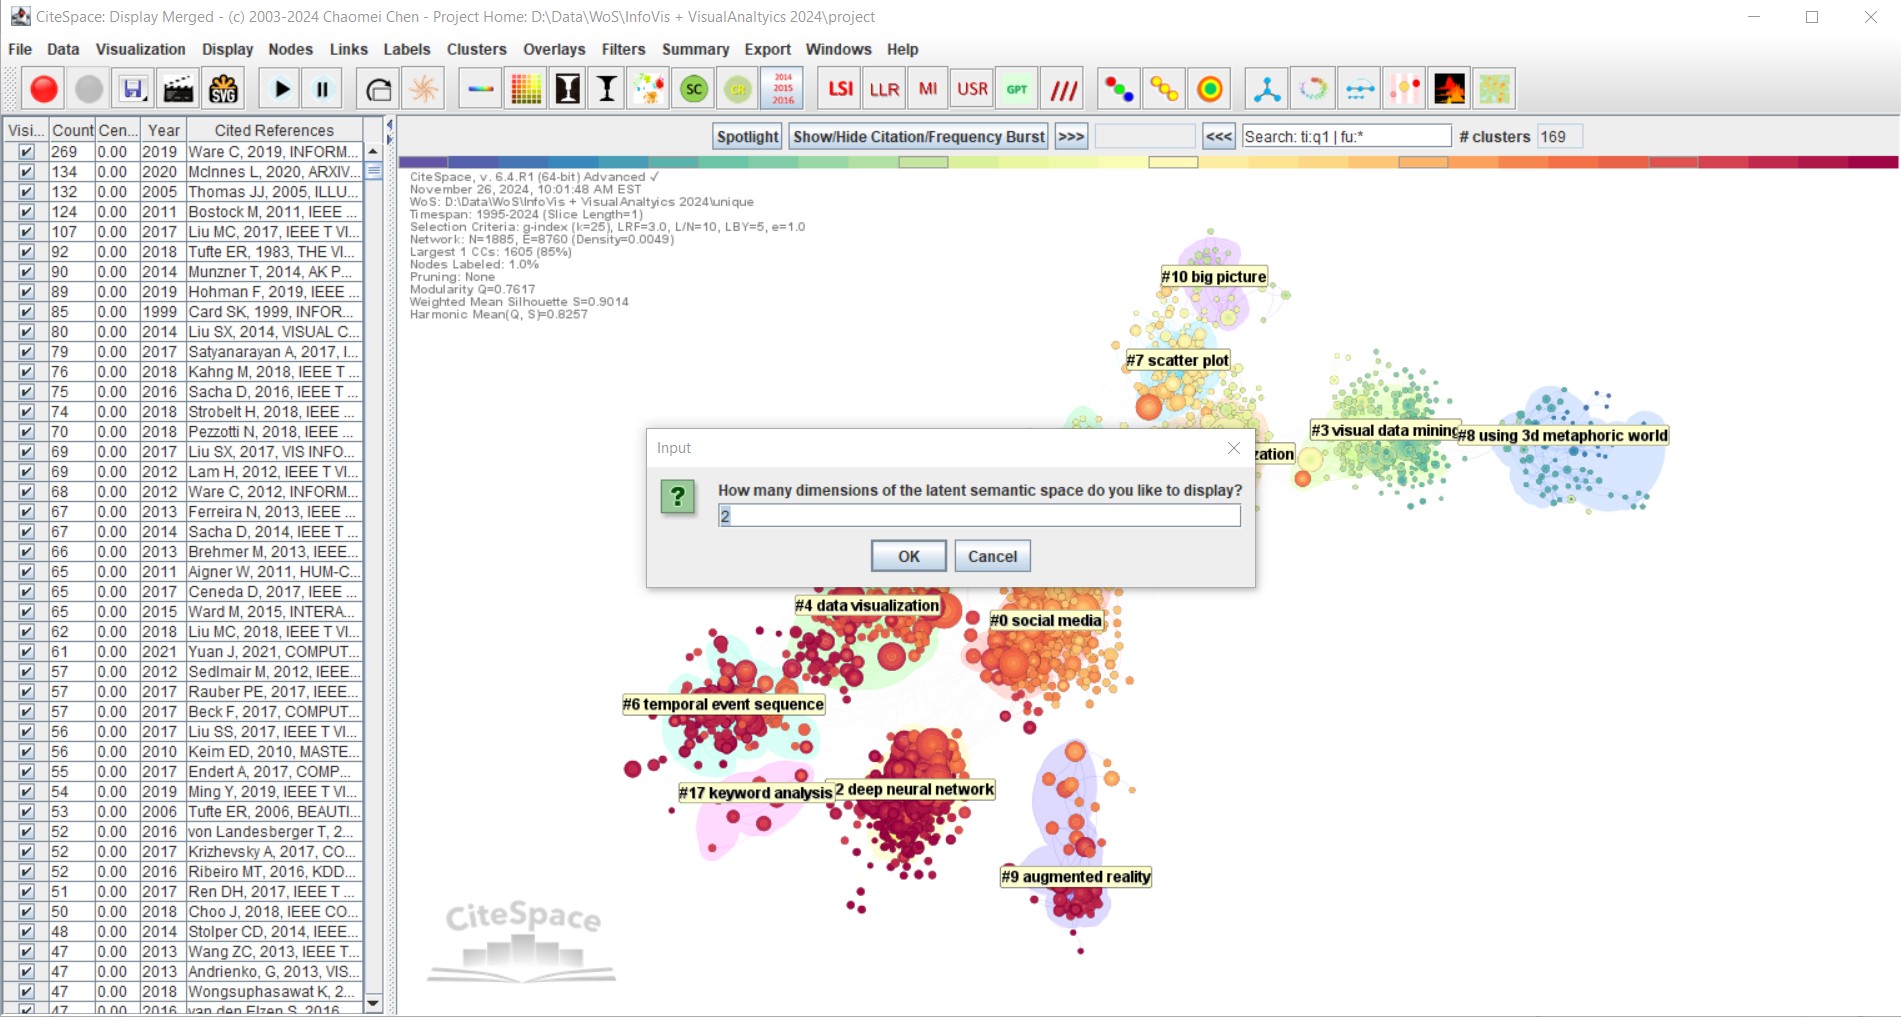
The year-by-year cluster labeling function is positioned in the middle of the tool bar just before the LSI button. Click on it. You will see a dialog box asking how many dimensions to be displayed for each cluster. If you choose 2, 2 columns of labels will be shown each year for every cluster.
Similarly, the next question is how many terms per dimension to display. By default, CiteSpace will show 3 labels in each dimension.
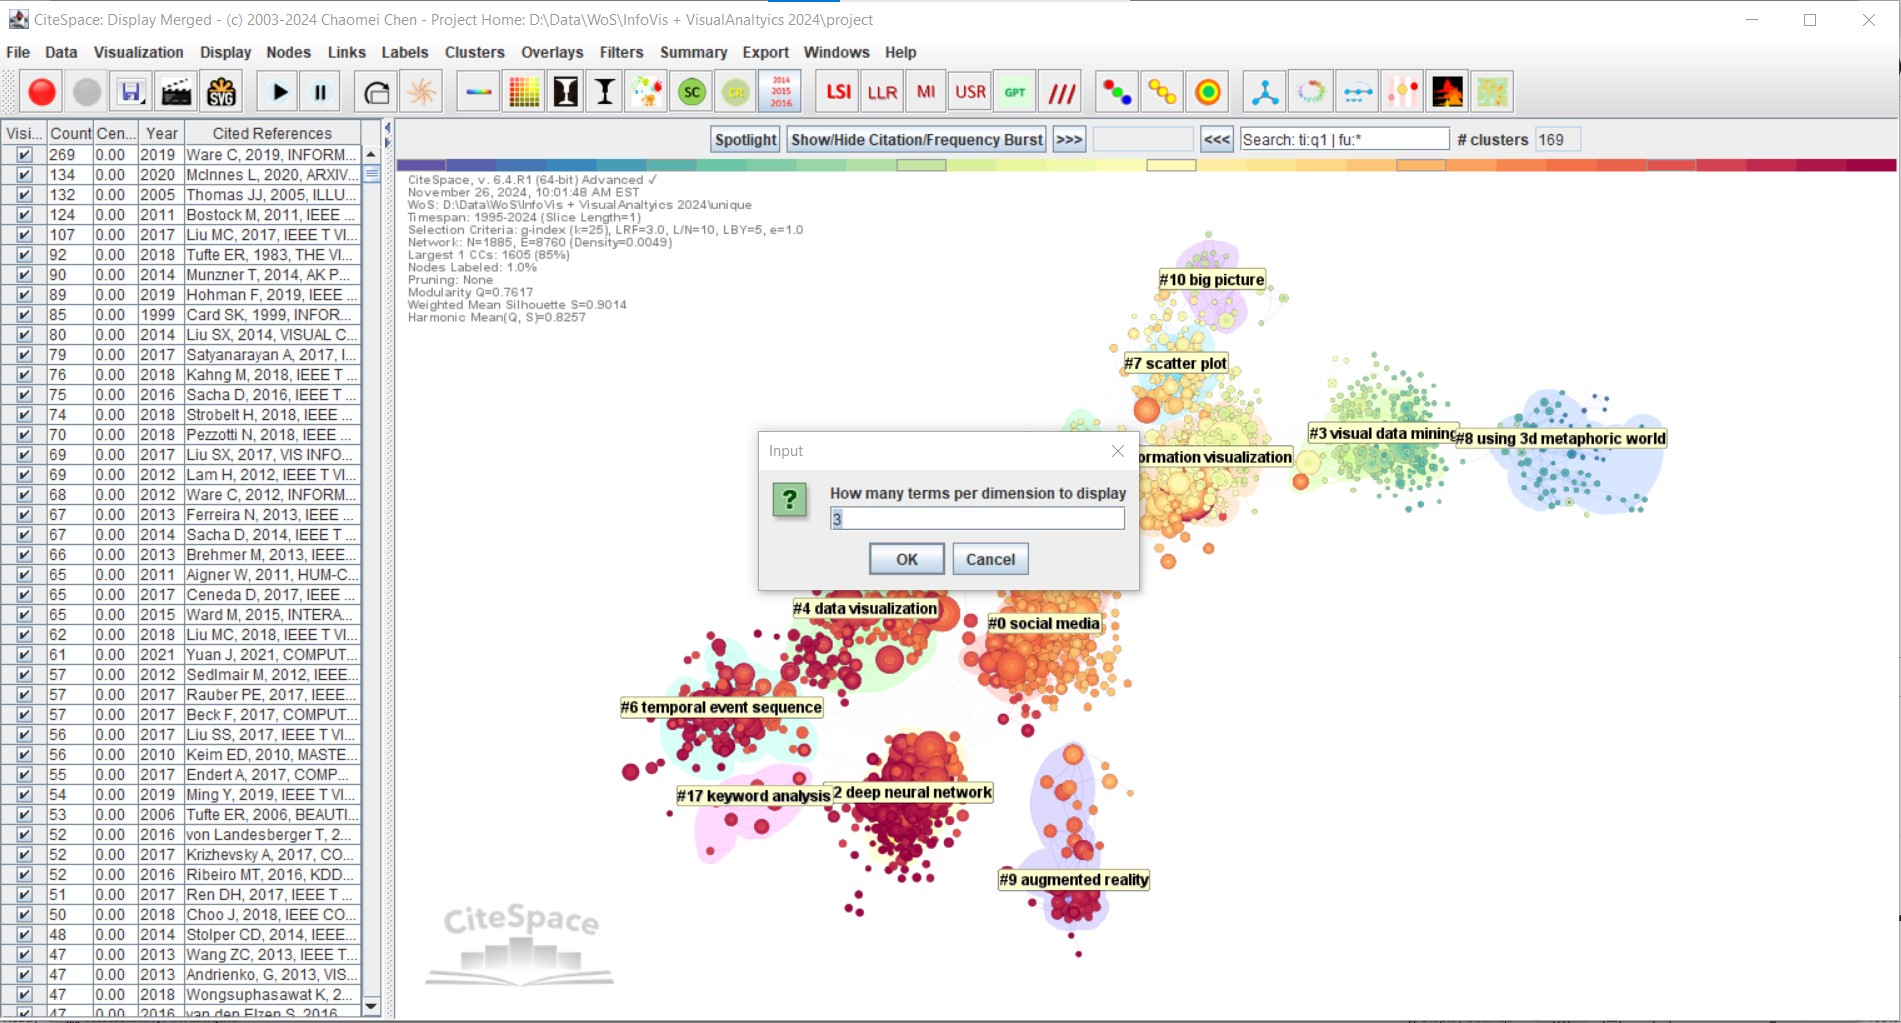
Finally, you are asked to choose the source to draw these labels. The default choice is from the Title field of a record.

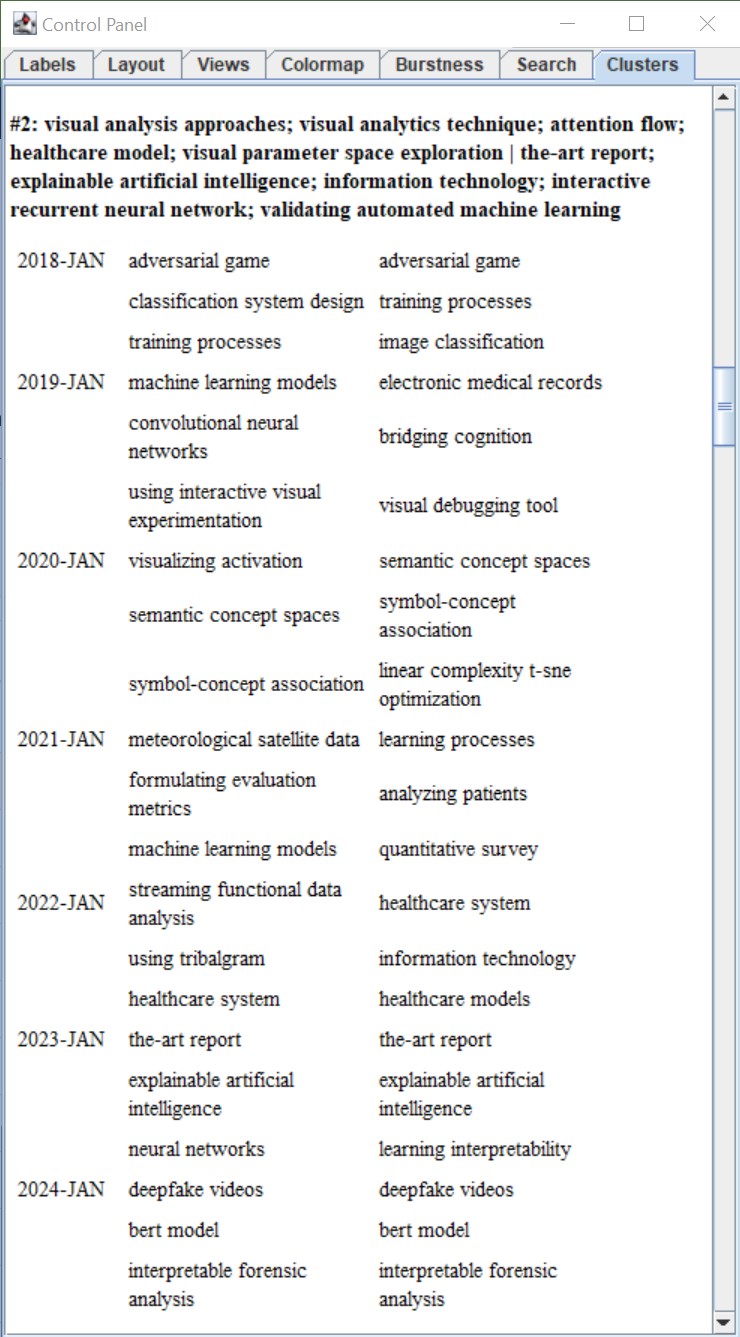
The results will be shown in the Control Panel under the Clusters tab. As you can see below, the evolution of a cluster is shown in terms of two columns (dimensions) of labels (terms) each year.
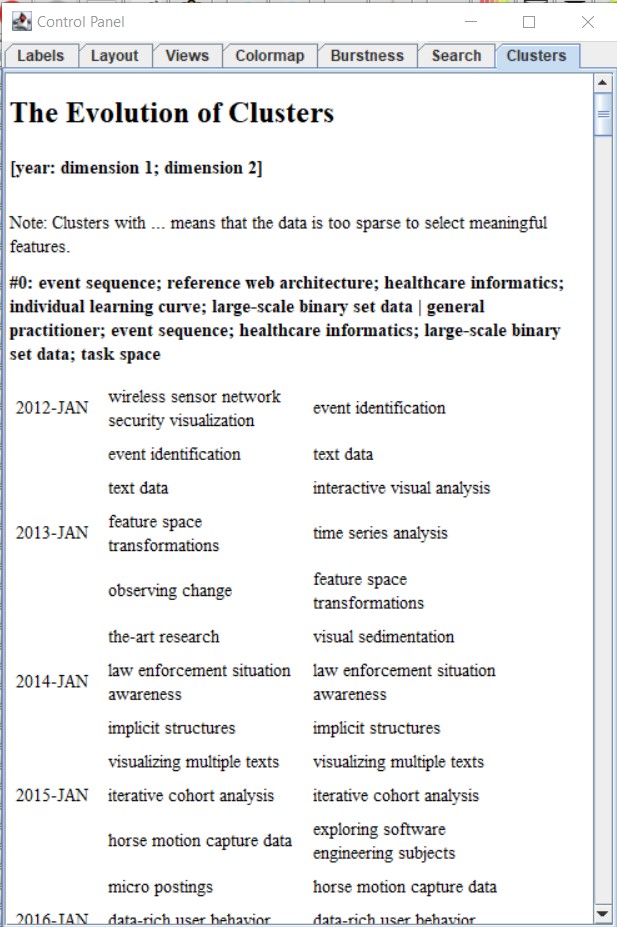
The following shows Cluster #2. Its overall cluster label is deep neural network. Bear in mind, this is in the broader context of information visualization and visual analytics. Convolutional neural networks appeared for the first time in 2019. Semantic concept spaces appeared in 2020. Explainable artificial intelligence appeared in 2023. Deep fake videos appeared in 2024, so did BERT model.
In summary, the year-by-year cluster labeling function can be used to explore the evolution of a cluster over time.