- Jul 30, 2024
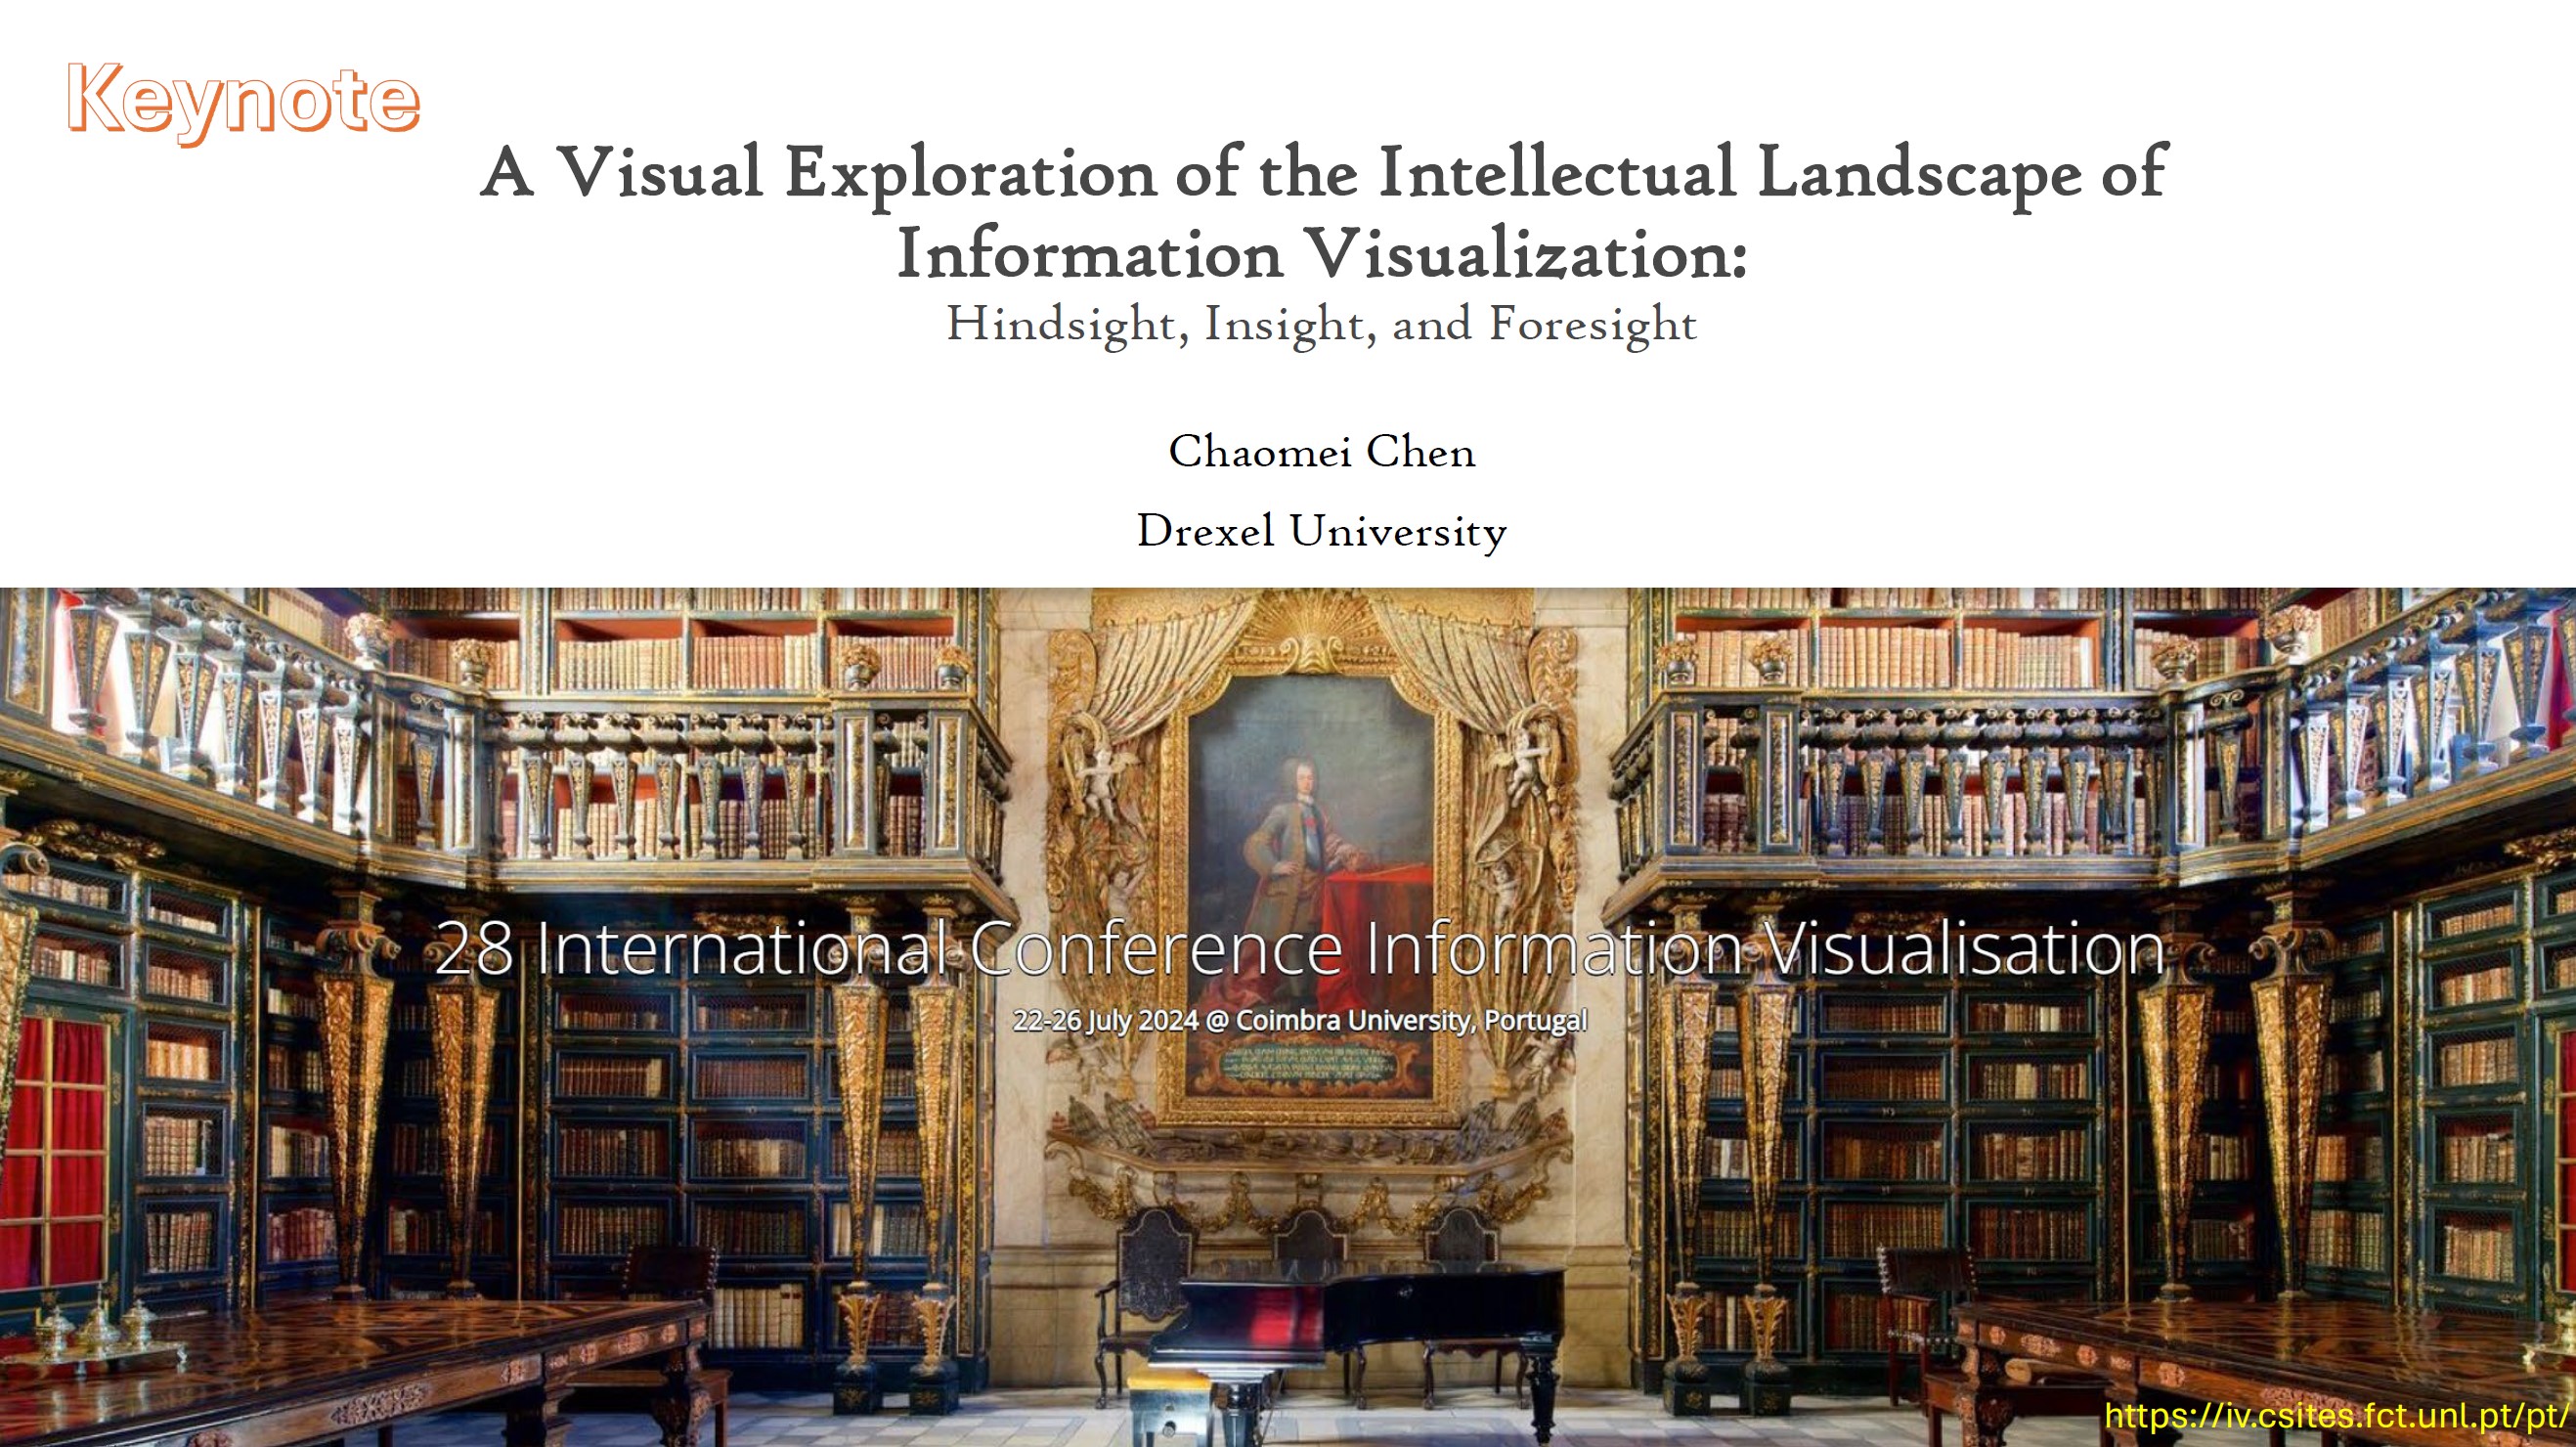
A Visual Exploration of the Intellectual Landscape of Information Visualization
- Chaomei Chen
- 0 comments
Here are some highlights of my keynote speech on July 24, 2024 at the 28th International Conference on Information Visualization in Coimbra, Portugal. The focus was on the hindsight, insight, and foresight one may learn about the development of the field of information visualization and visual analytics based on the relevant scholarly literature published between 1991 and 2024. You can download the slides with this link https://doi.org/10.13140/RG.2.2.21672.17929
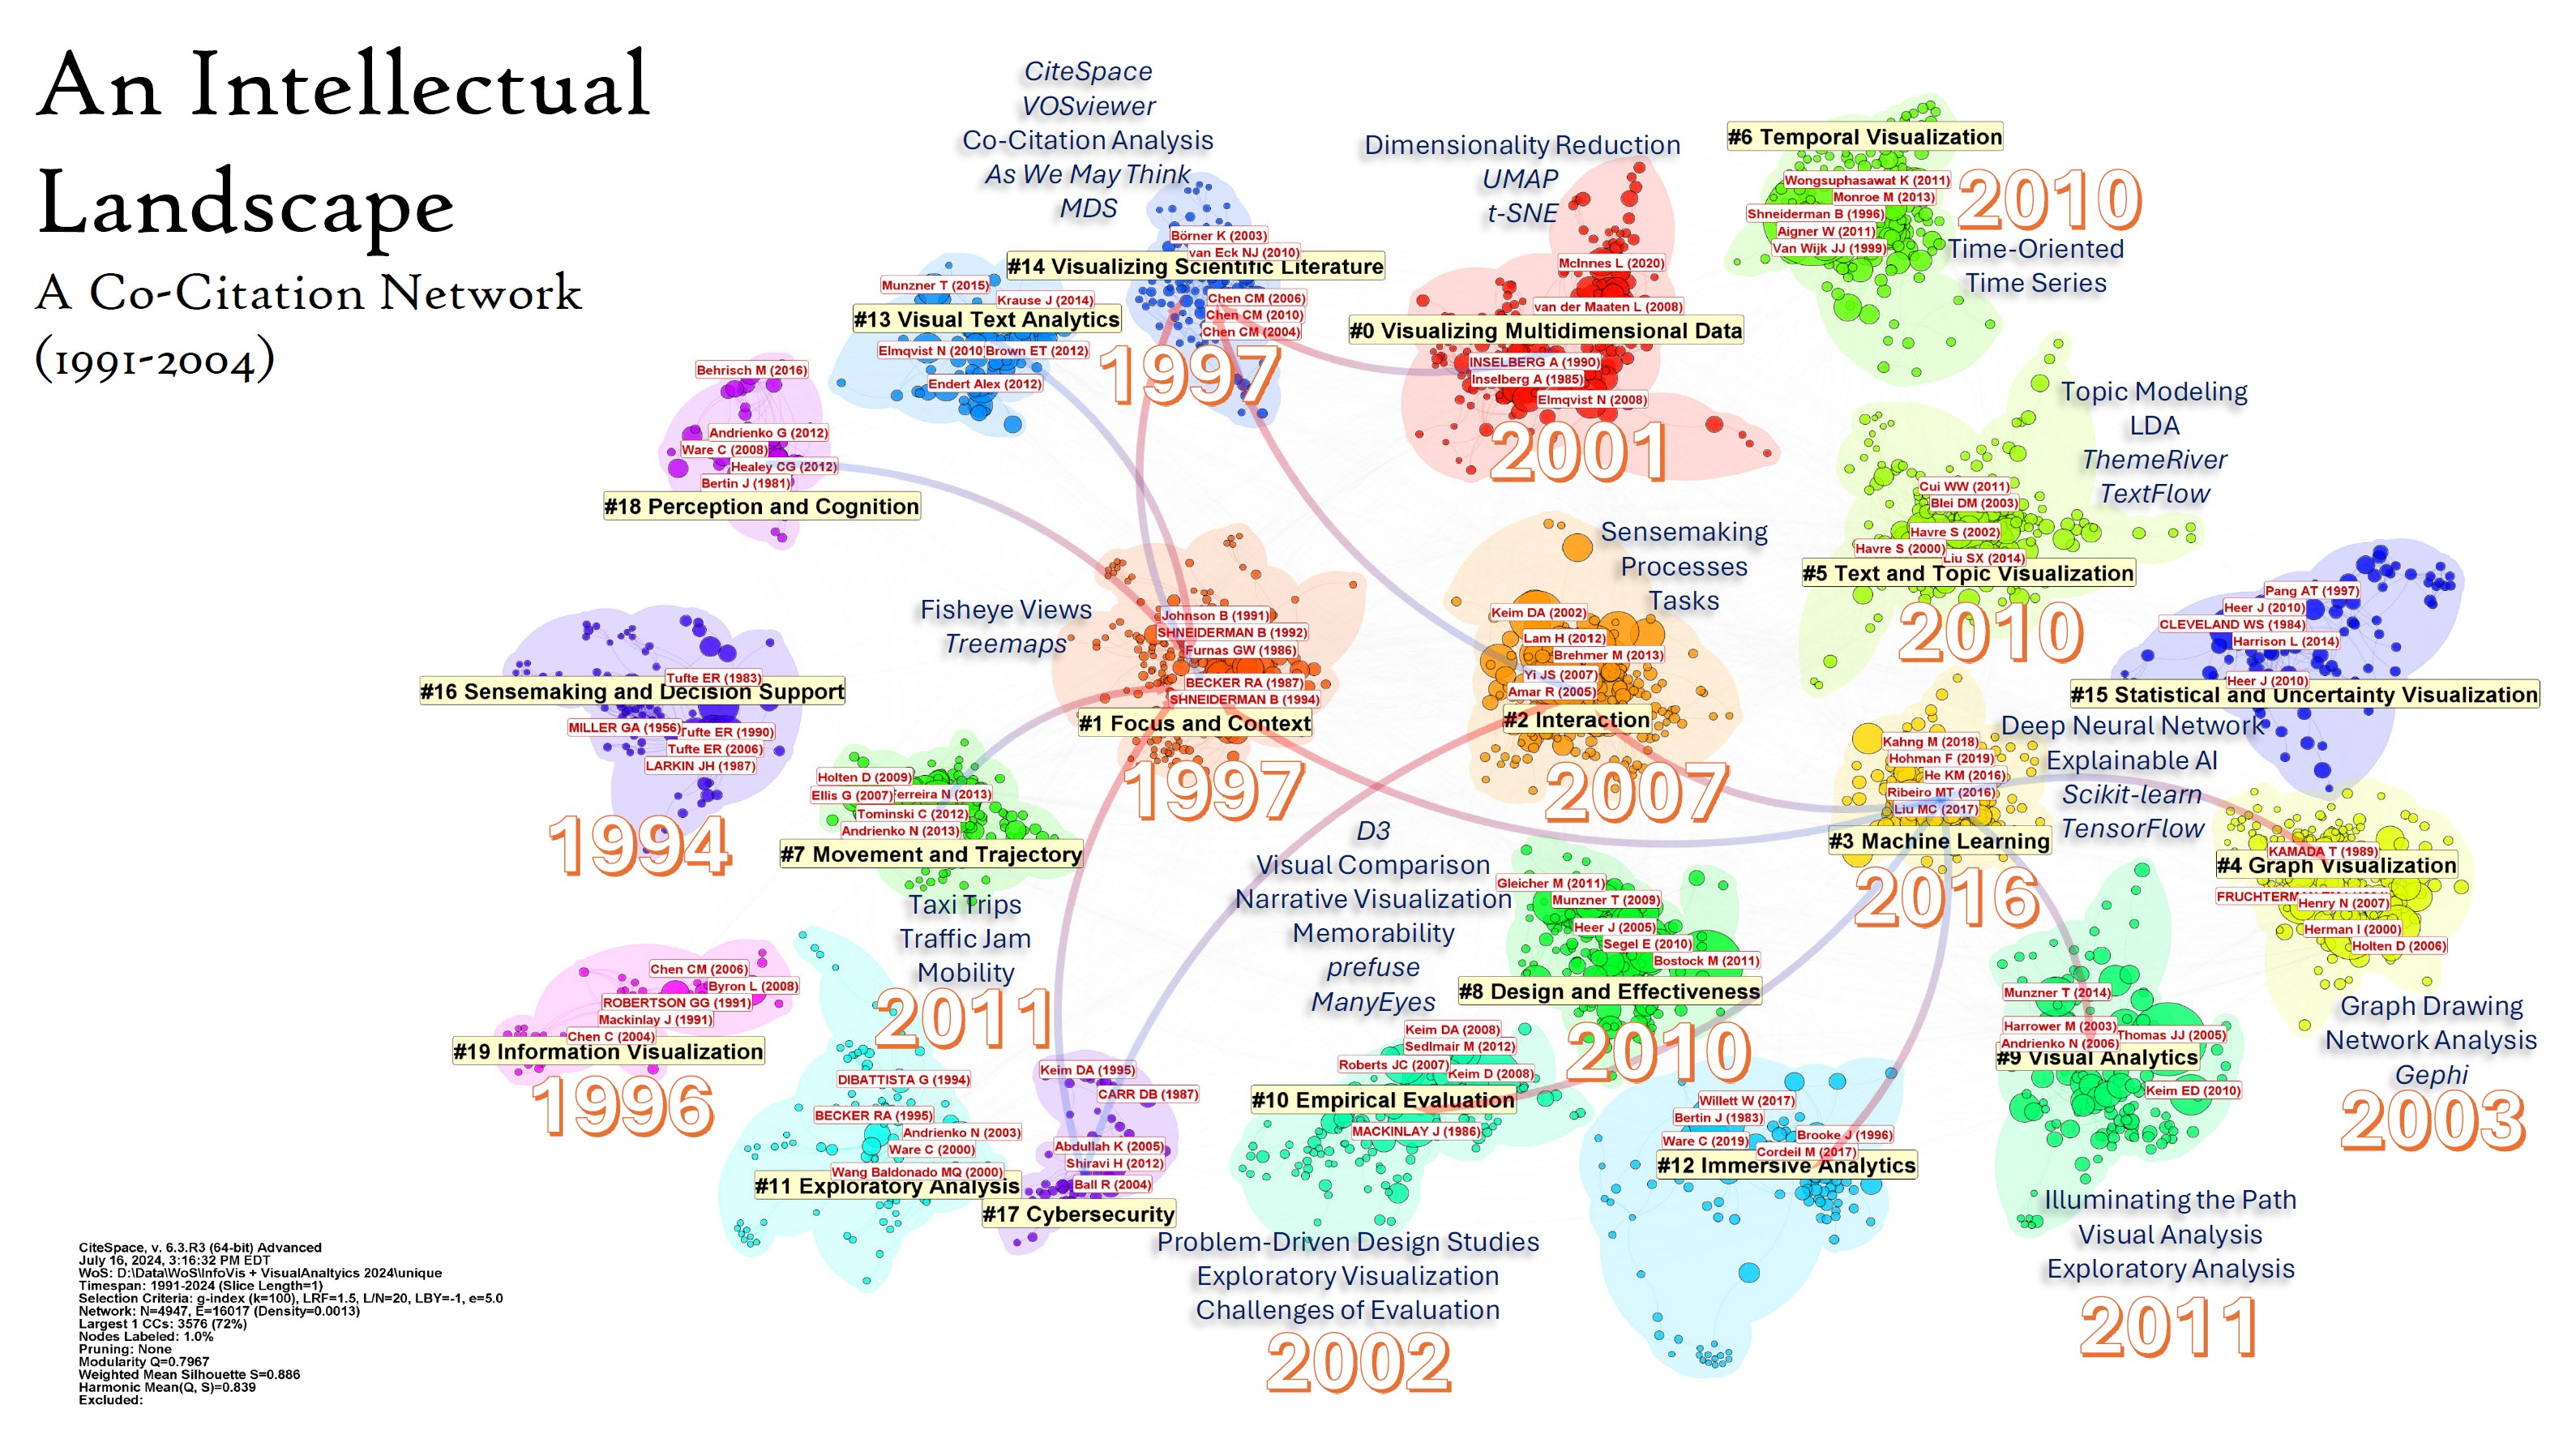
Here is an overview of the intellectual landscape of the field. Note the 1991-2004 was a typo, it should be 1991-2024. The largest and the long-lasting cluster is #0 Visualizing Multidimensional Data (in red). The prominent and the fitting theme is Dimensionality Reduction with the two very powerful and popular solutions, namely t-SNE and UMAP. The youngest cluster is #3 Machine Learning, which featured themes such as Deep Neural Network, Explainable AI, as well as tools such as Scikit-learn and TensorFlow. Multiple cluster-dependency arrows point to 6 other clusters, indicating how this relatively new cluster is drawing valuable information for previous works in these areas.
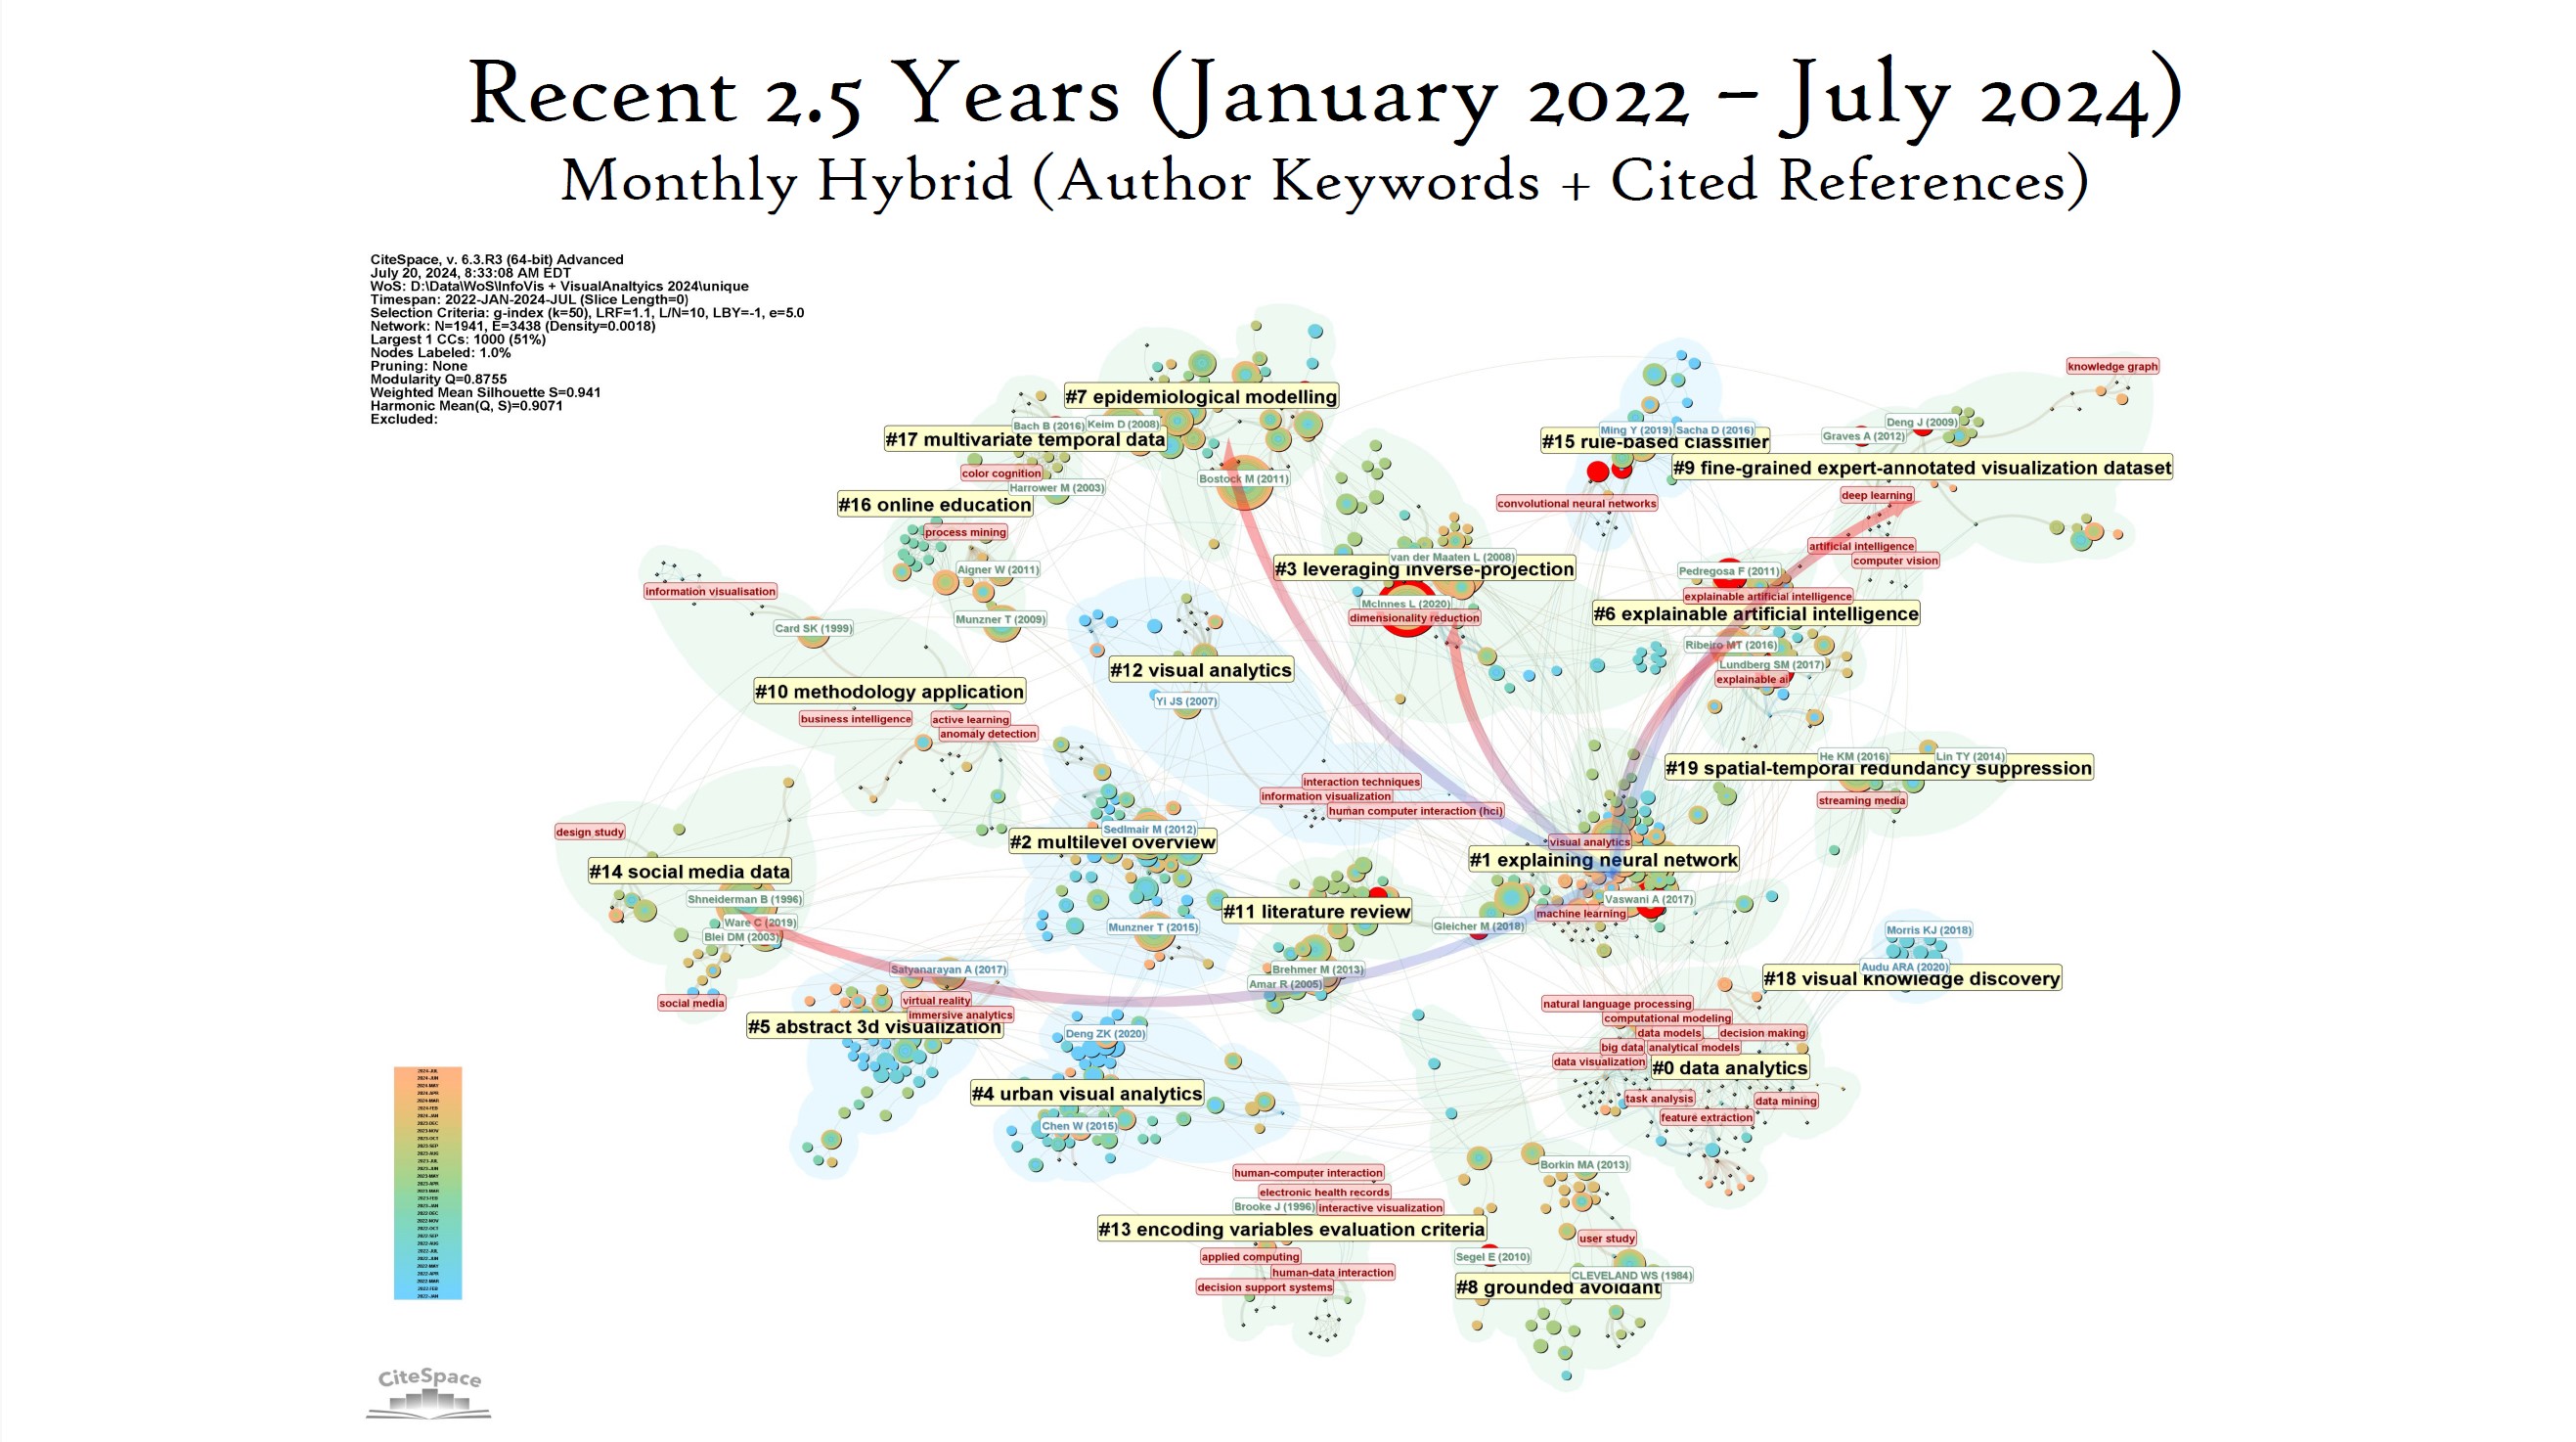
While the usual annual time-slicing gives us an overview over a 3-decade long timespan, the most recent developments can be revealed with a finer level of granularity. Here is a monthly-sliced time interval of the recent 2.5 years.
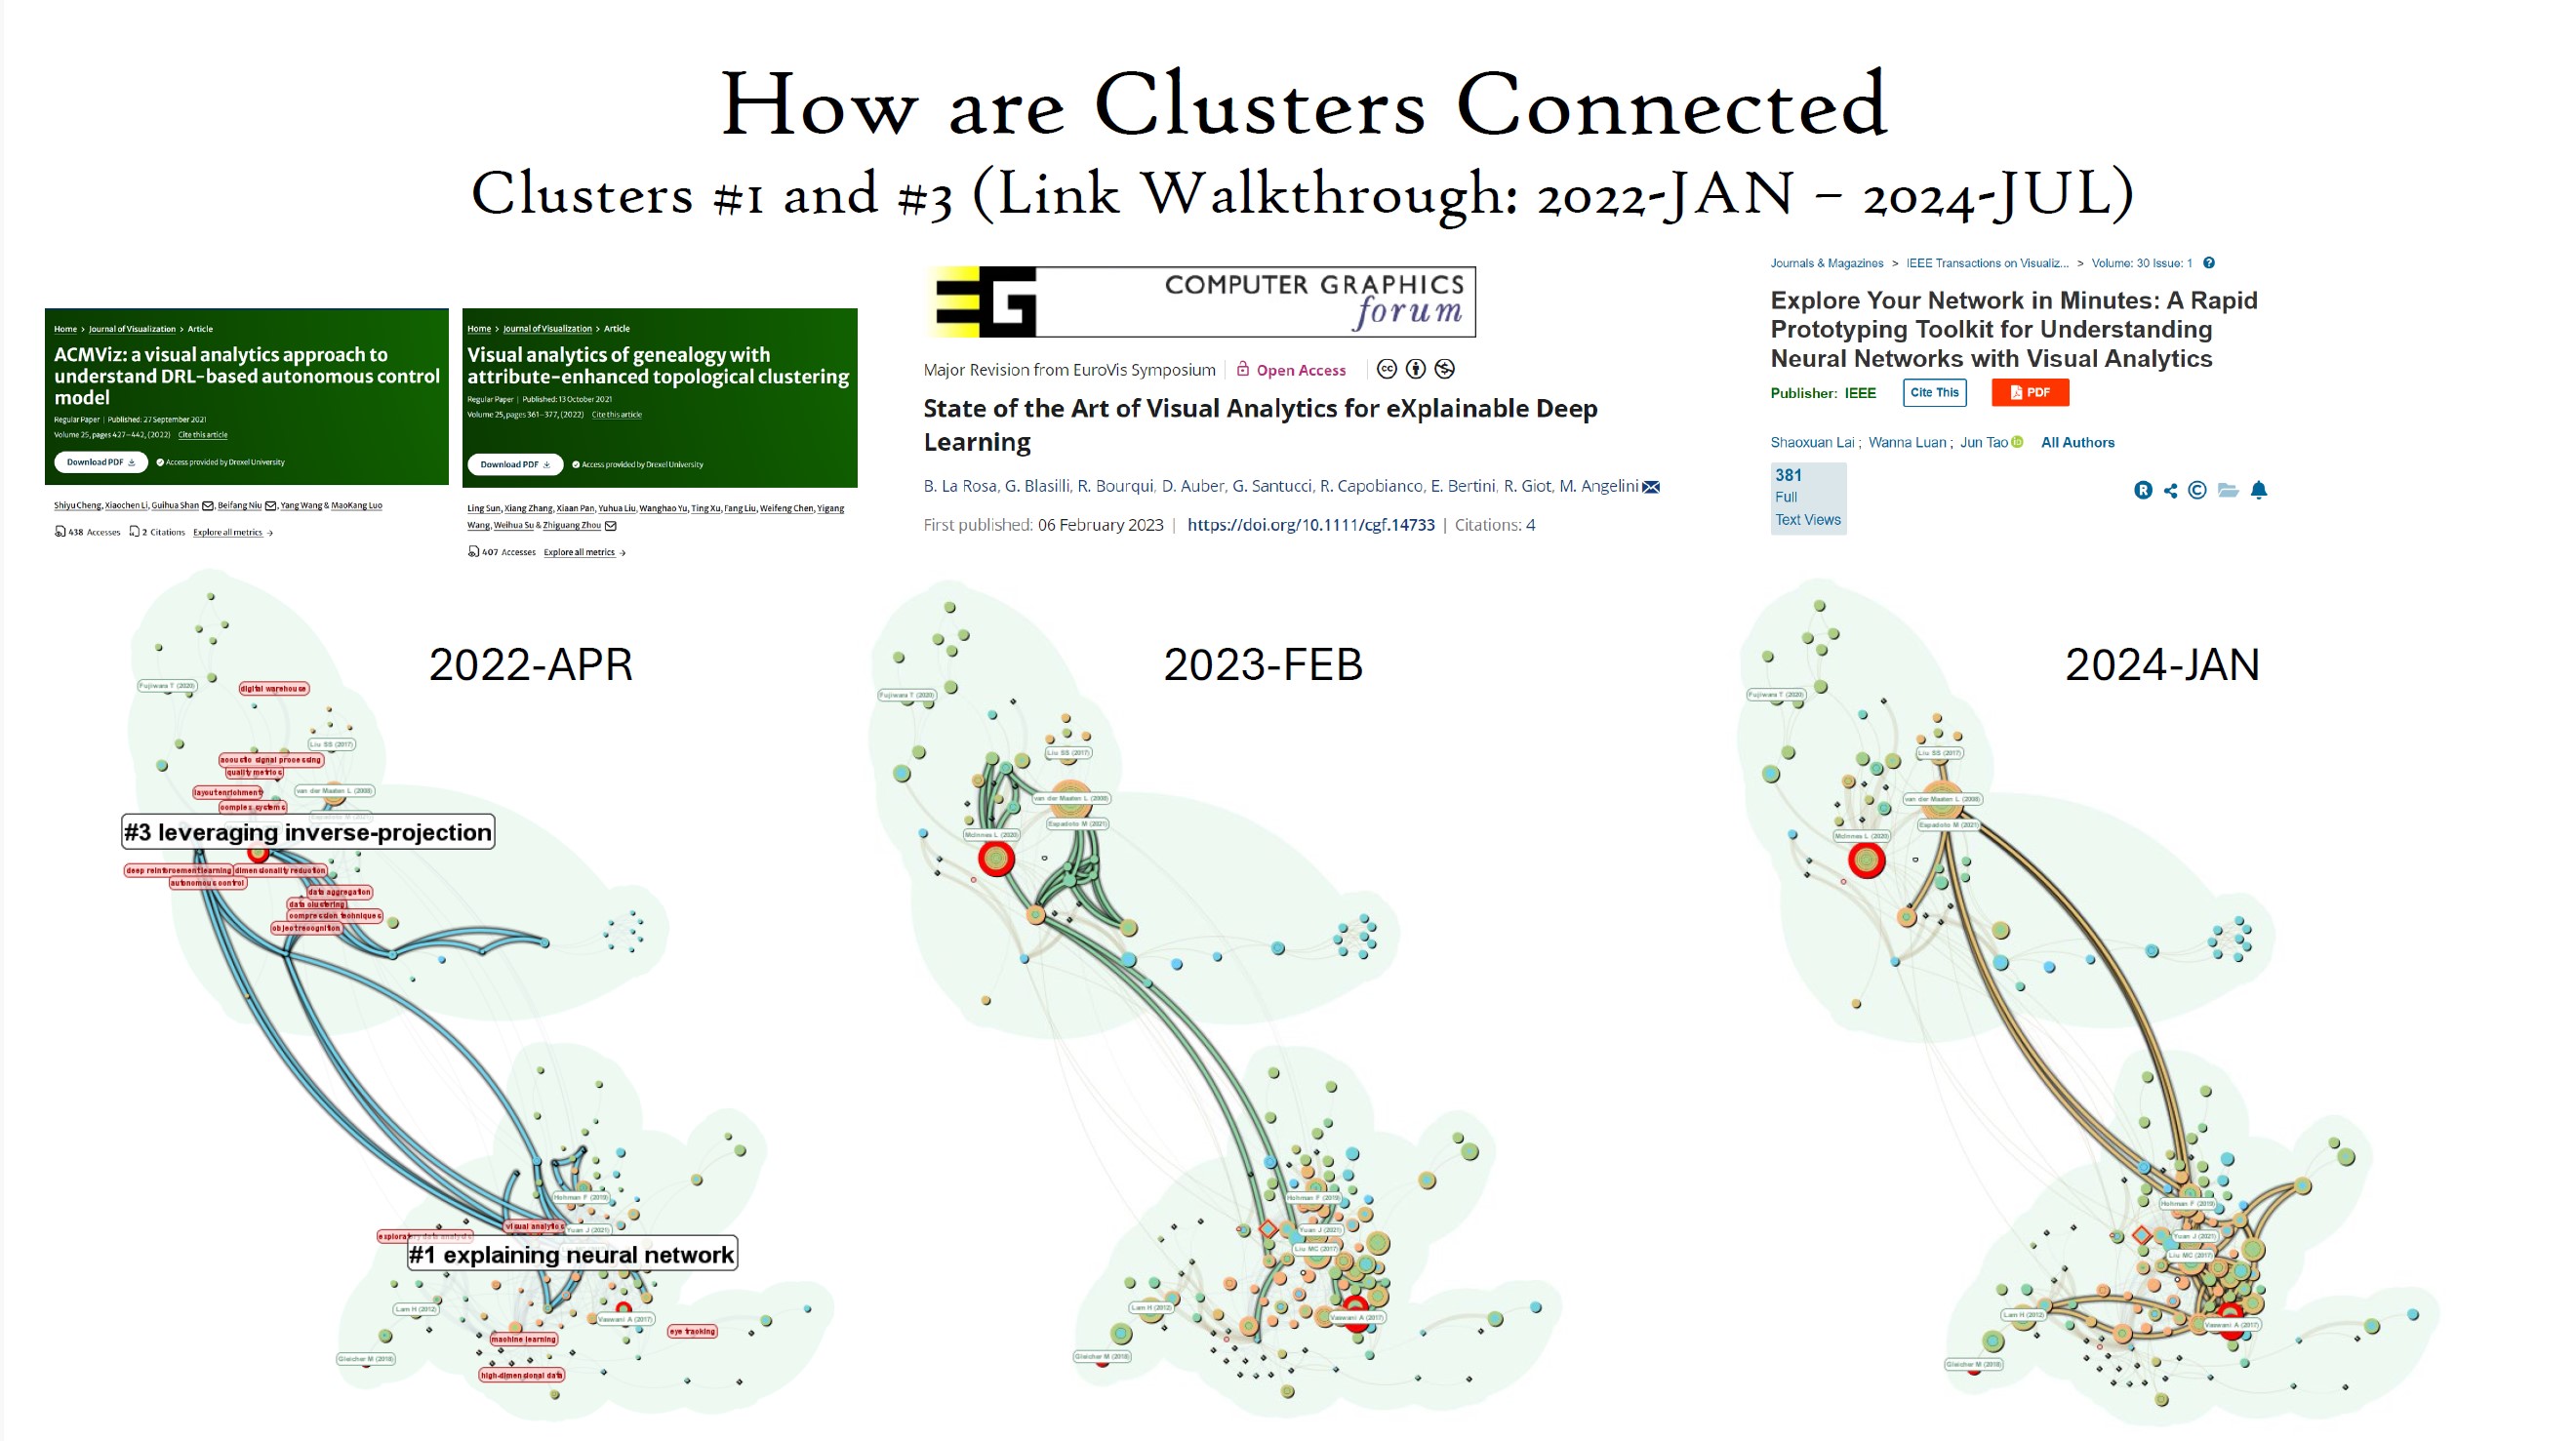
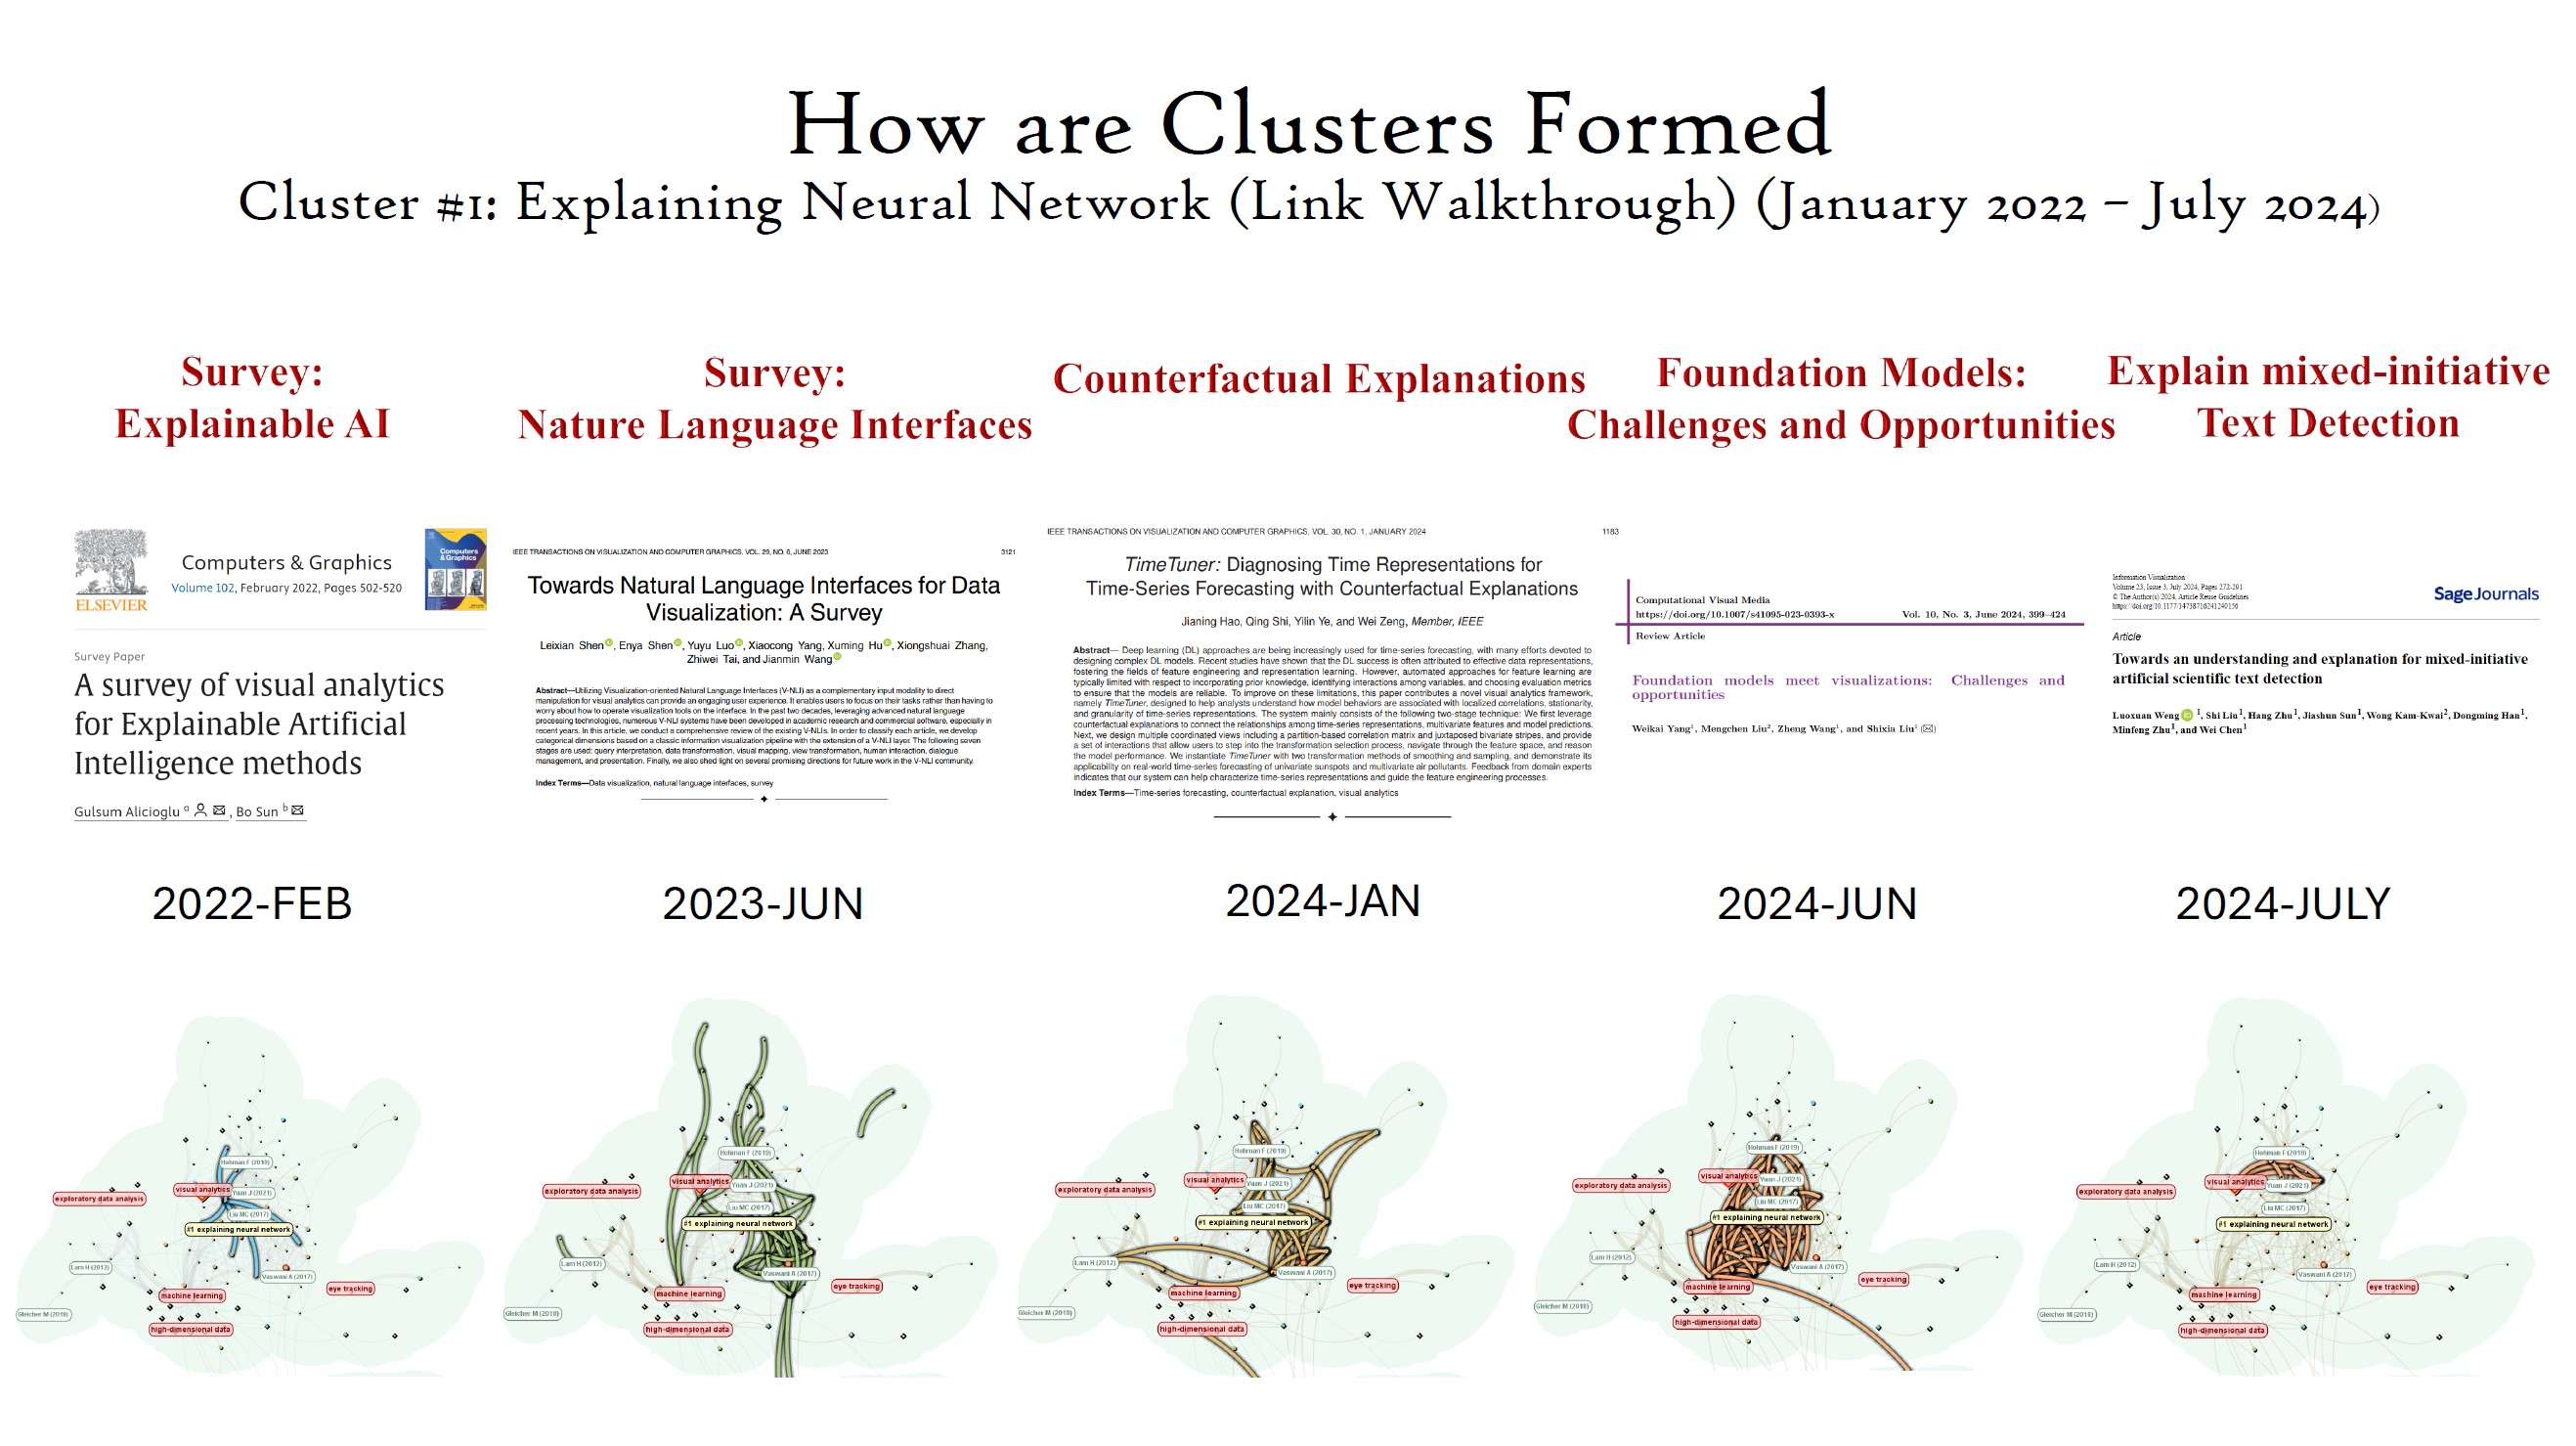
Given a cluster of interest, we would often like to know how the cluster is formed over time. Who or which publications did essentially shape up the cluster? We can use the Link Walkthrough function to visualize co-citation links added in a particular time slice, in this case, narrowed down to the month of the publication. We can then right click on any node highlighted on the snapshot to reveal the citing article that is responsible for the contributions. The following 5 makers of the clusters are identified accordingly, including the most recent article published in July, which is the same month as we visually explored the landscape in Coimbra, Portugal.
We are already aware of the significance of intellectual bridges or potential bridges between distinct clusters. If you need a refresher on why they are important, check my previous presentations and publications. Then the question is: which publications are contributing such inter-cluster connections. In other words, which articles are simultaneously citing works that belong to different clusters? Again, we used the same drill of combining the Link Walkthrough and the right-click pop-ups, which led to the following 3 articles.