- Jul 3, 2025
Scopus
- Chaomei Chen
- 0 comments
Scopus is a major source of data for bibliometric and scientometric studies. I will demonstrate the key steps of preparing your dataset with Scopus and visualizing trends and patterns in scientific literature with the current version of CiteSpace 6.4.R2.
Search
The user interface of Scopus is straightforward to use. I will simply use the topic of CiteSpace as an example. Similar to the topic search function in the Web of Science, the Article title, Abstract, Keywords search is a good starting point. This illustrative search found 9,308 documents. Check your results and make sure they are indeed relevant.
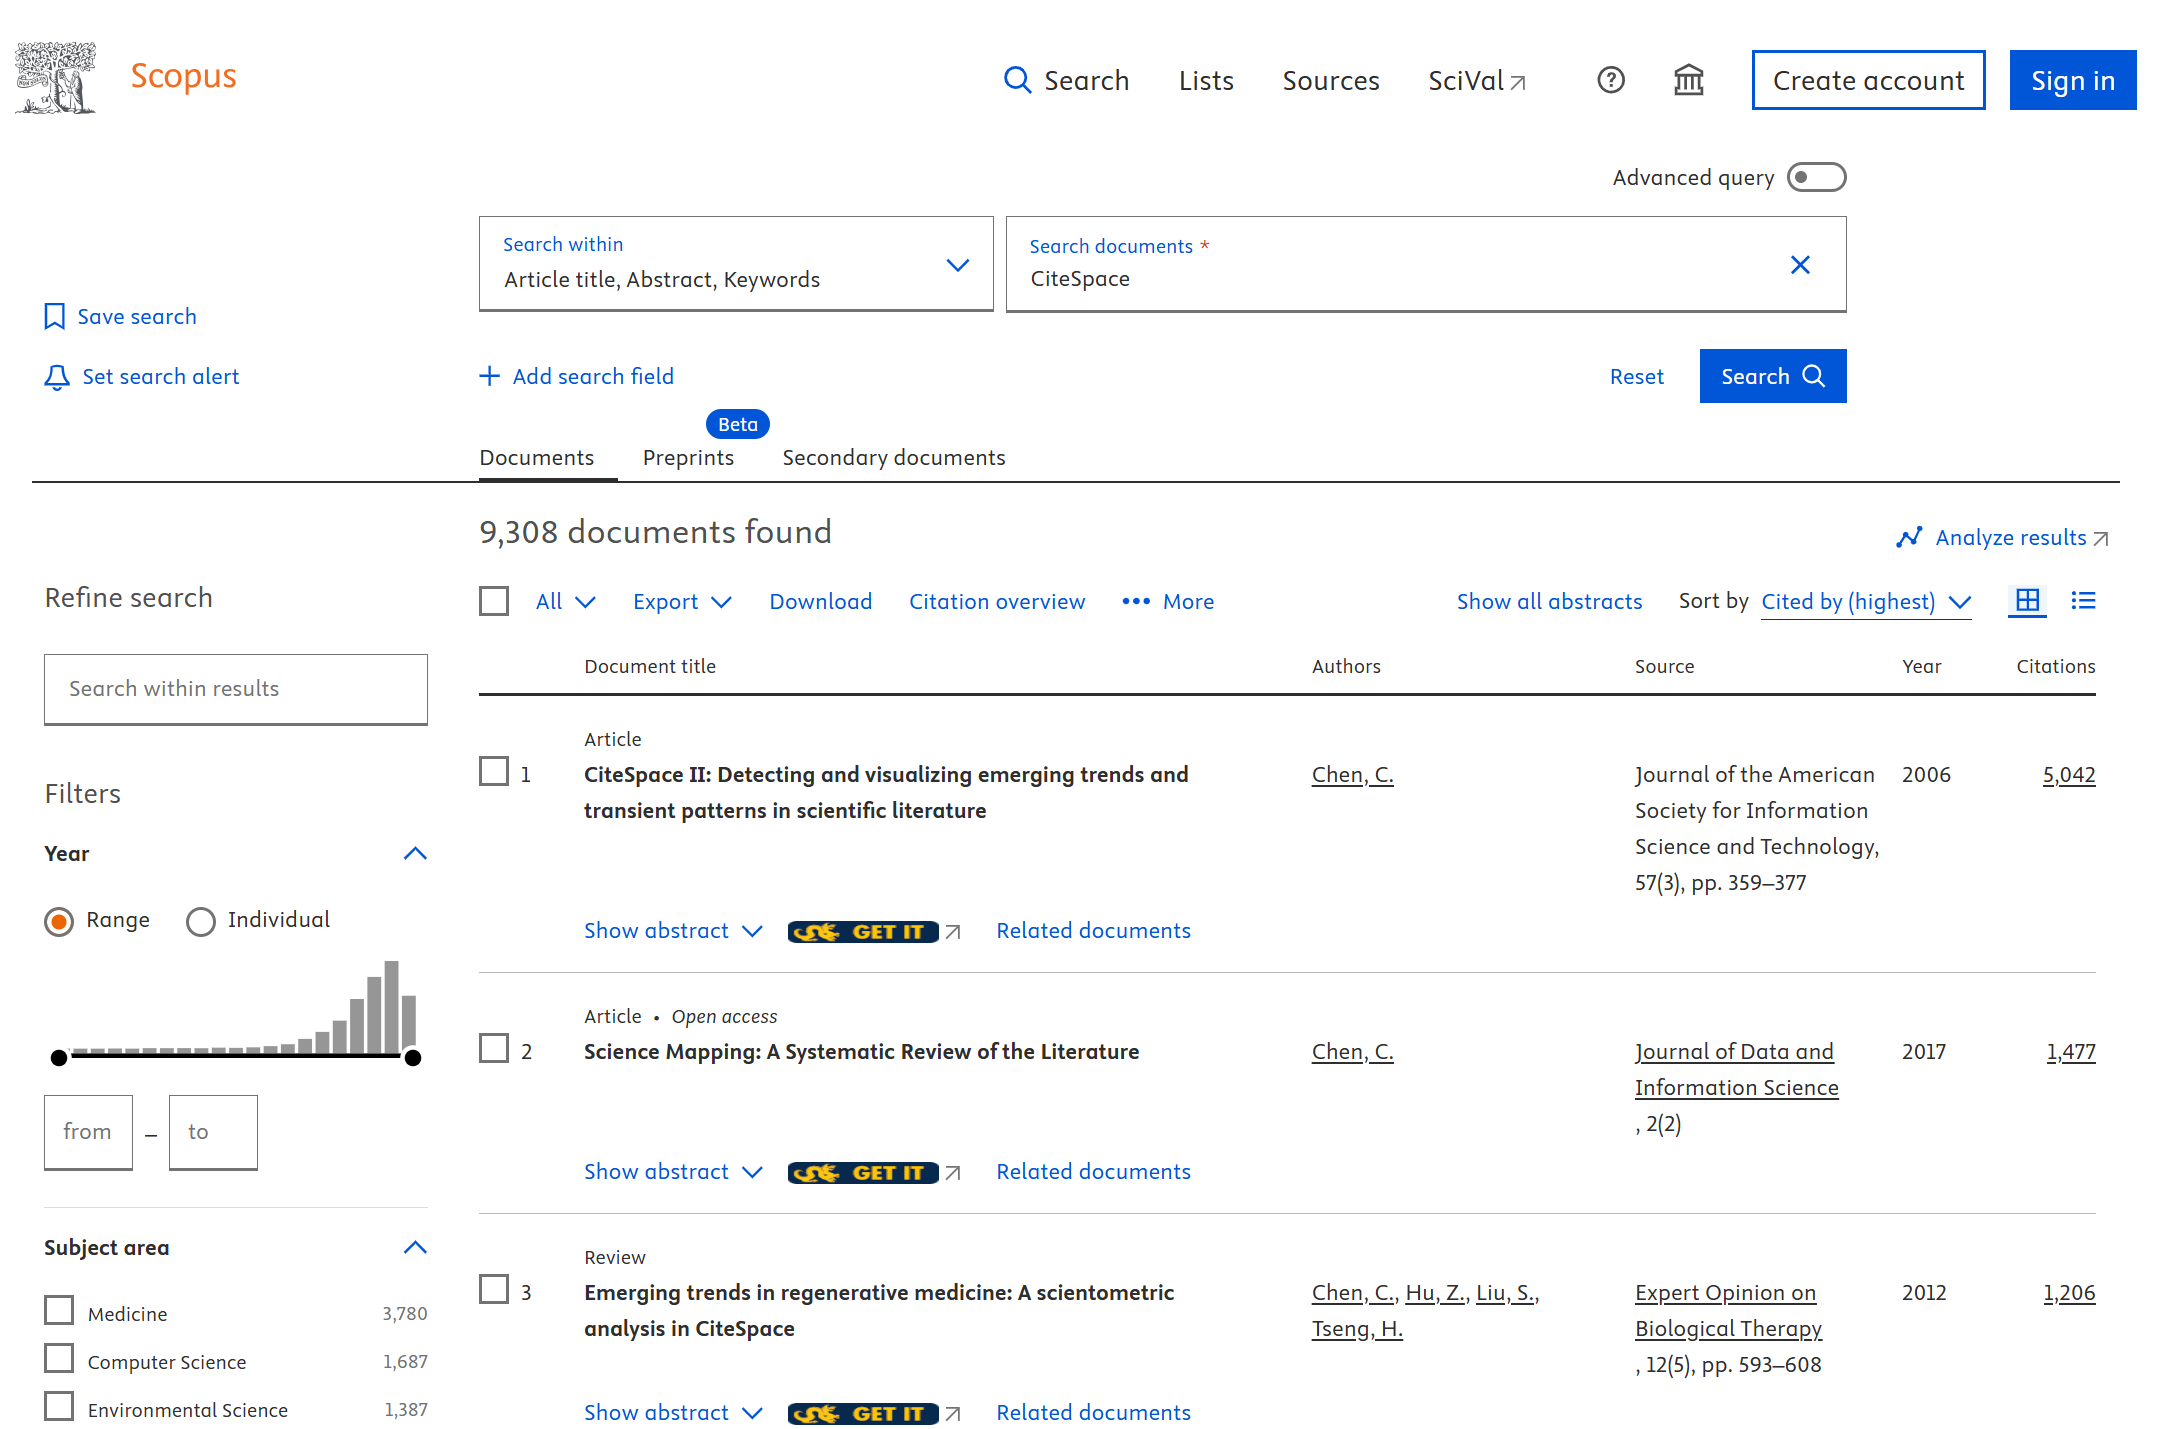
The next step is to export the 9,308 documents and take them to CiteSpace for subsequent processing and generating visualizations.
Export
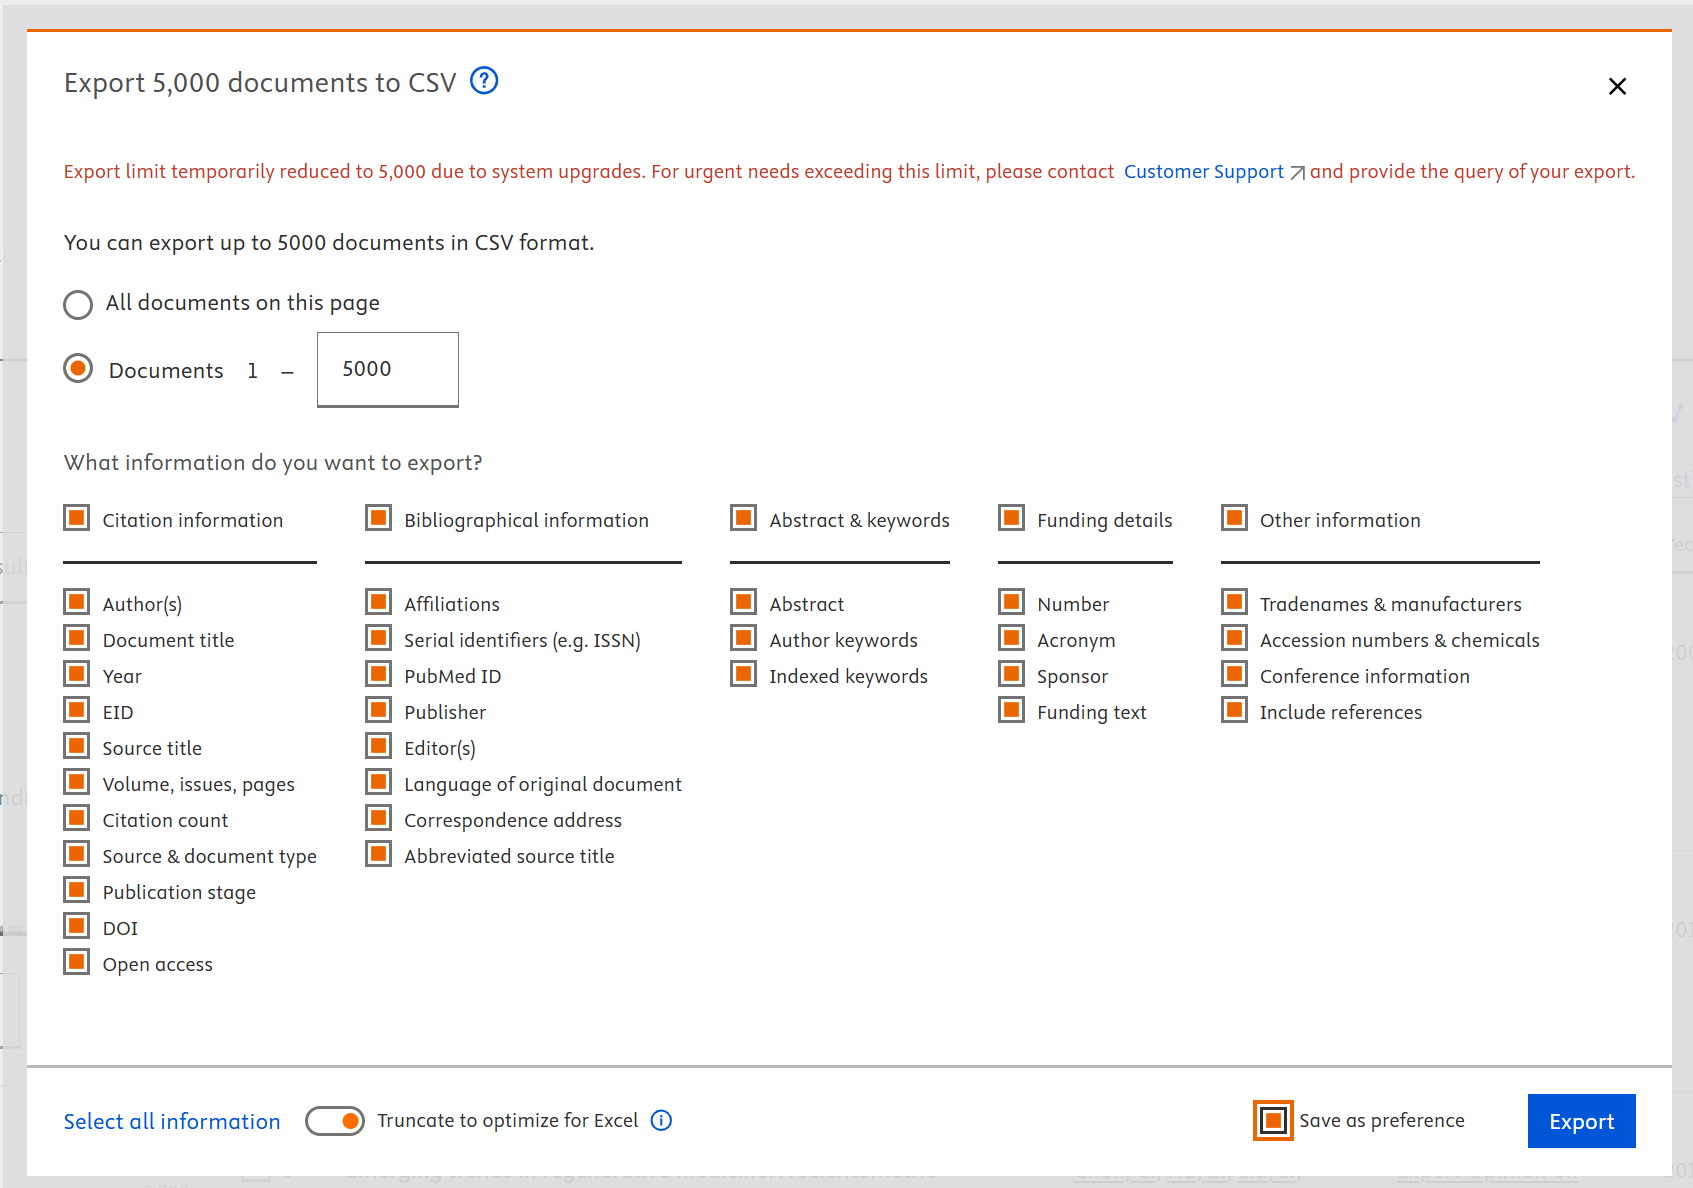
We need to export the search results to CSV files. As you can see in the screenshot below, a temporary limit of 5,000 documents is imposed. I will show you how to download 9,308 documents, which are exceeding the 5,000 document limit.
Make sure you select ALL the fields to export, exactly as shown below.
Use a Filter
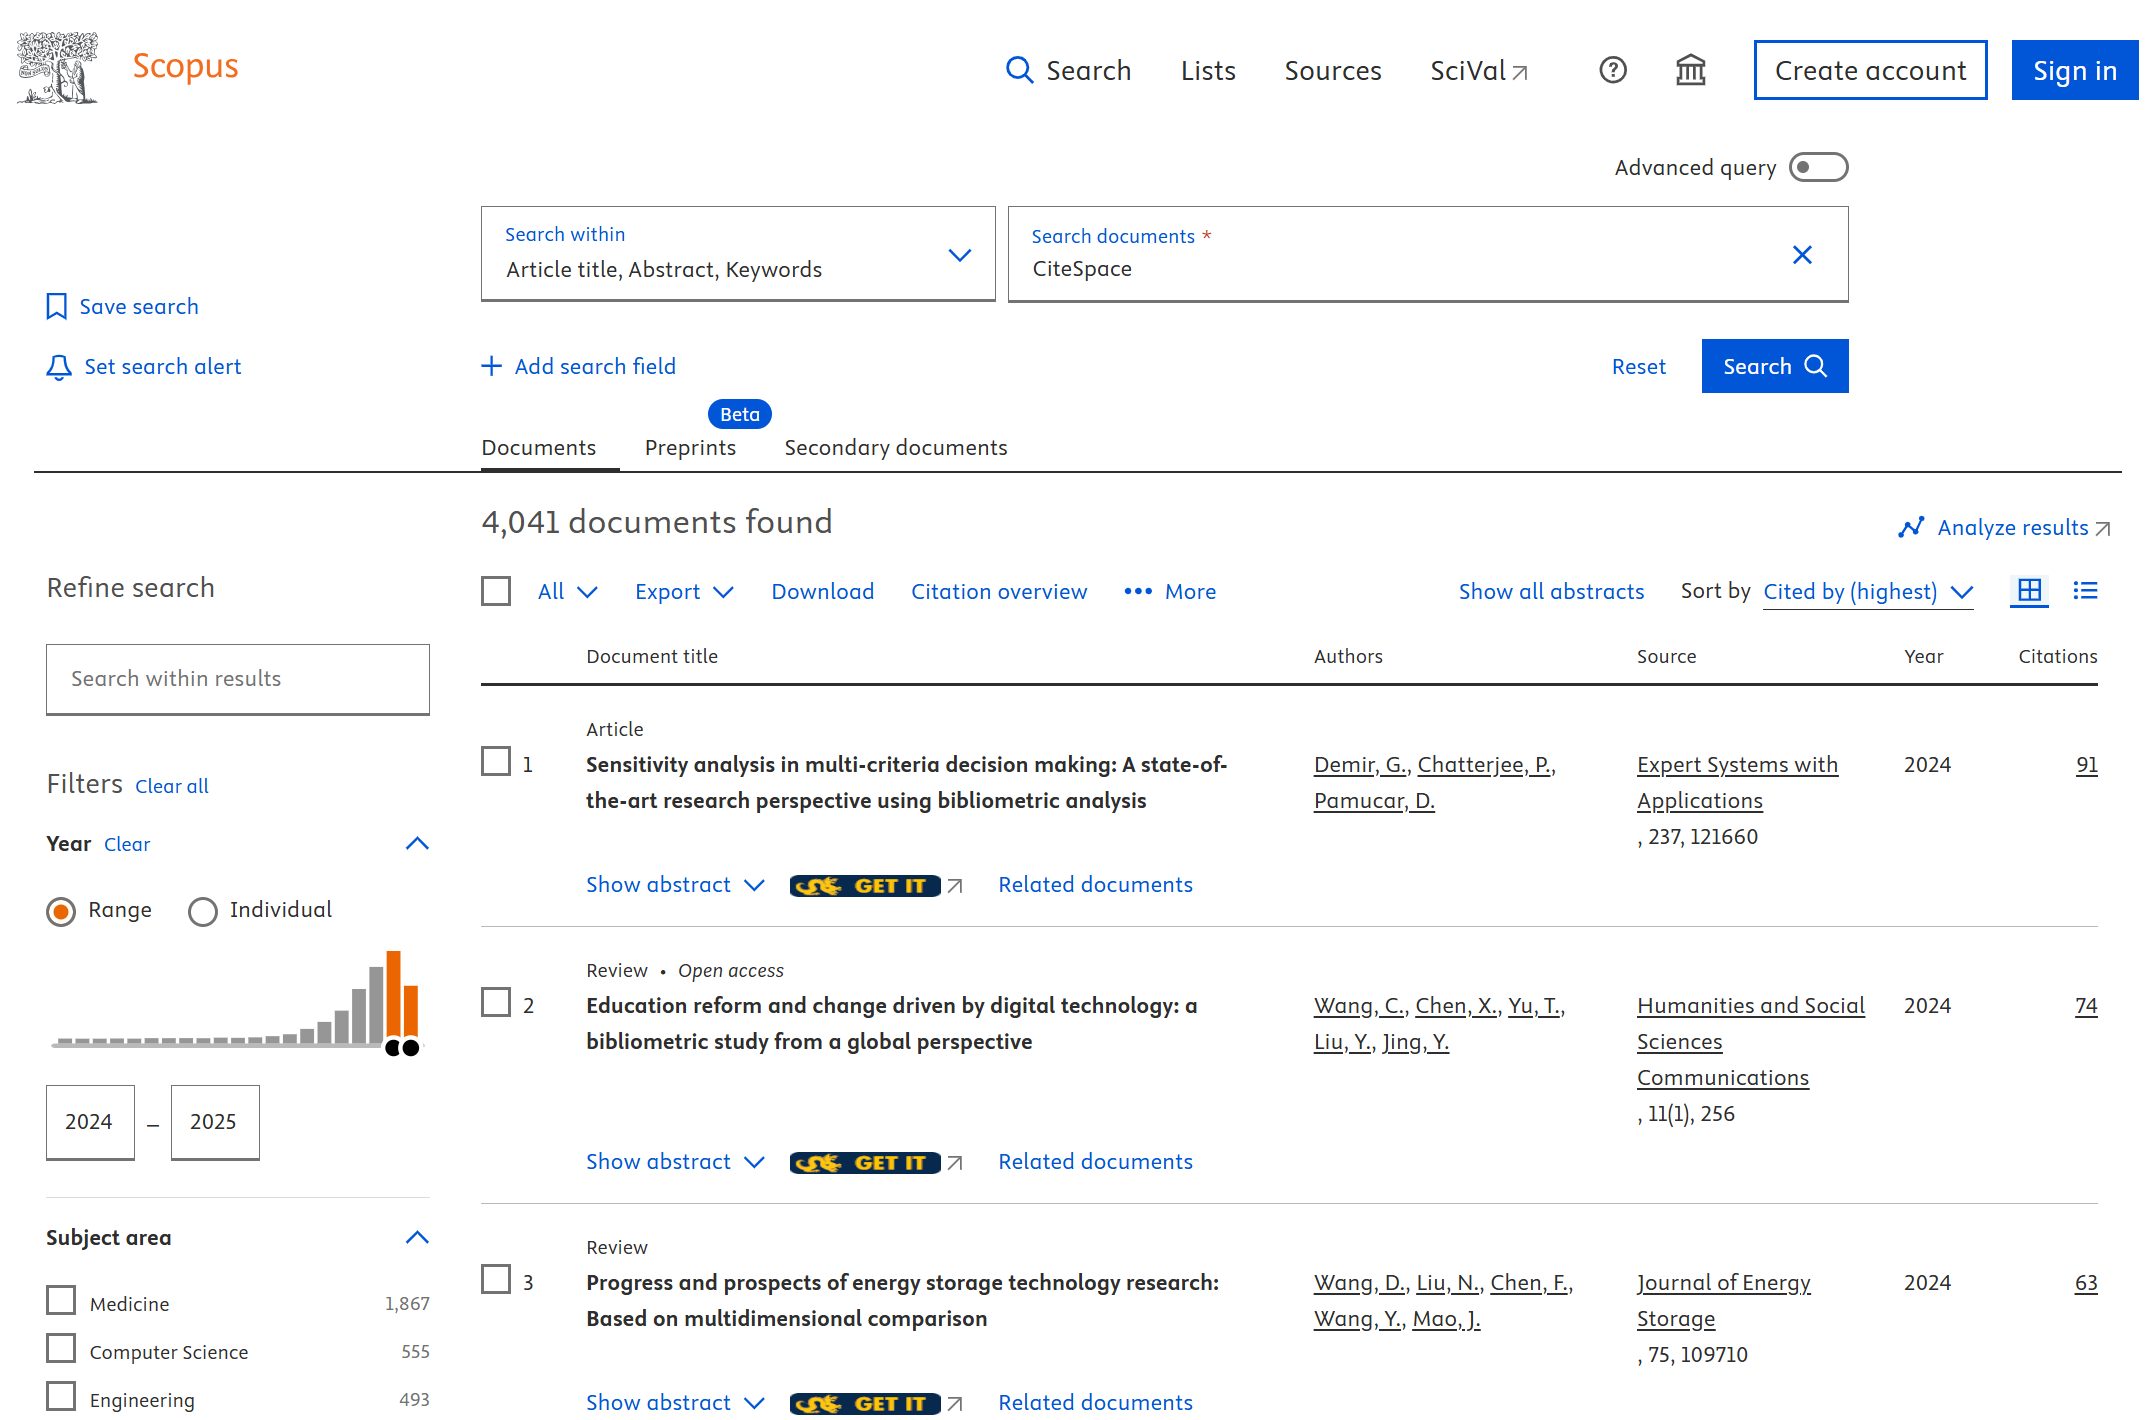
A simple way to get around the 5,000-document limit per export is to use a filter so that a larger dataset can be divided into a few subsets and each one of them is below the limit. For example, I filtered documents by the year of publication. If we limited the search results to the interval of 2024-2025, the total number of documents within this range is 4,041, just below the 5,000 limit. Repeat the process for all the intervals so that you export the entire set of search results in a few smaller chunks.
Preprocessing in CiteSpace
Now take the exported CSV files and perform the following preprocessing steps.
Conversion
I recommend you store the CSV exports from Scopus in a folder called data_original. Then create another folder data_converted, and the third folder called data_unique. I will explain how to use them shortly.
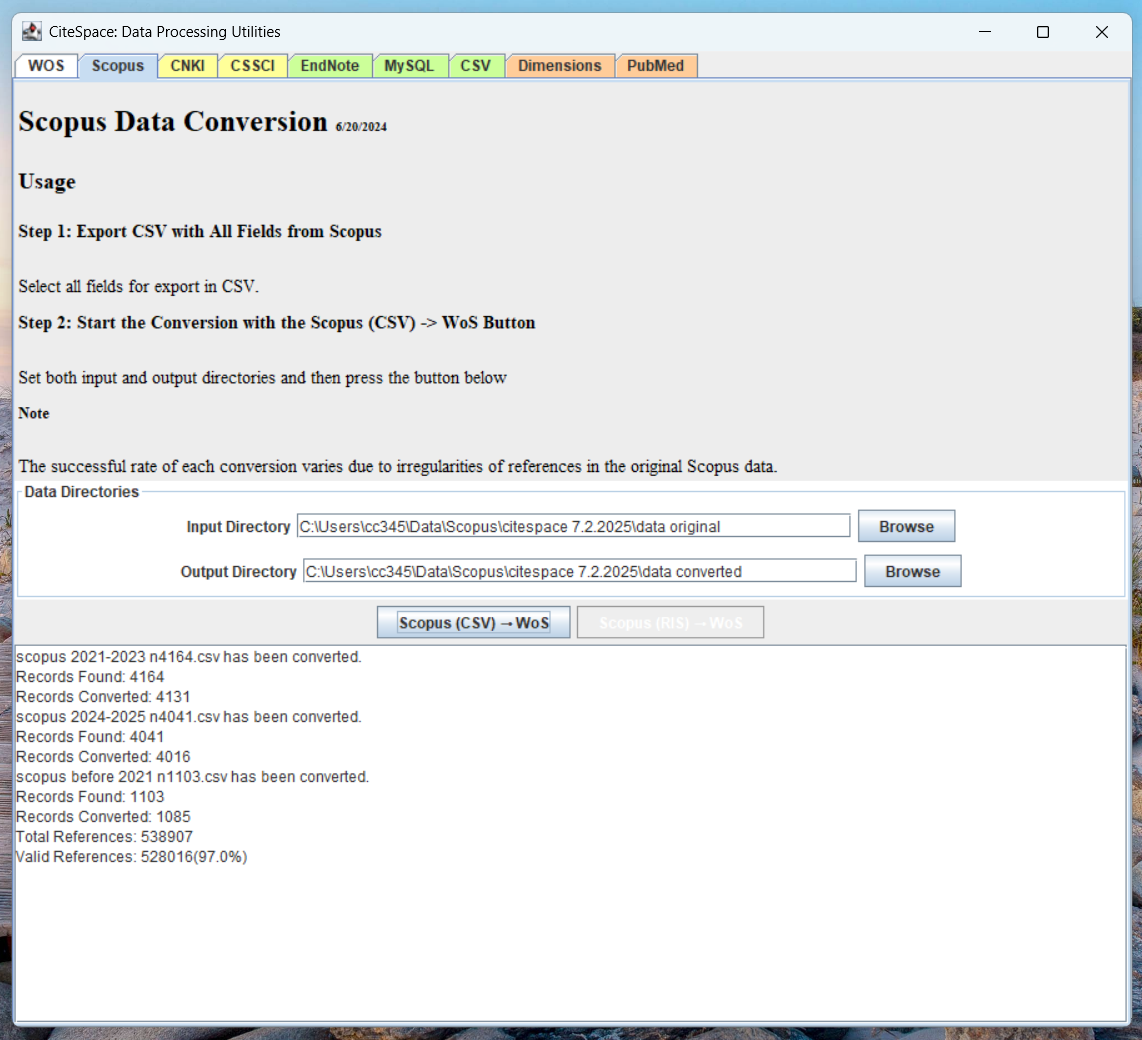
The first step is to convert the exported Scopus data from CSV to the Web of Science format so that CiteSpace can recognize these records. As illustrated with the screenshot below, the conversion function will take the input from the data_original folder and store the converted data in data_converted.
In this case, the entire dataset consists of 3 CSV files. The conversion function successfully converted 97.0% of the references. Obviously, the higher the conversion rate, the better.
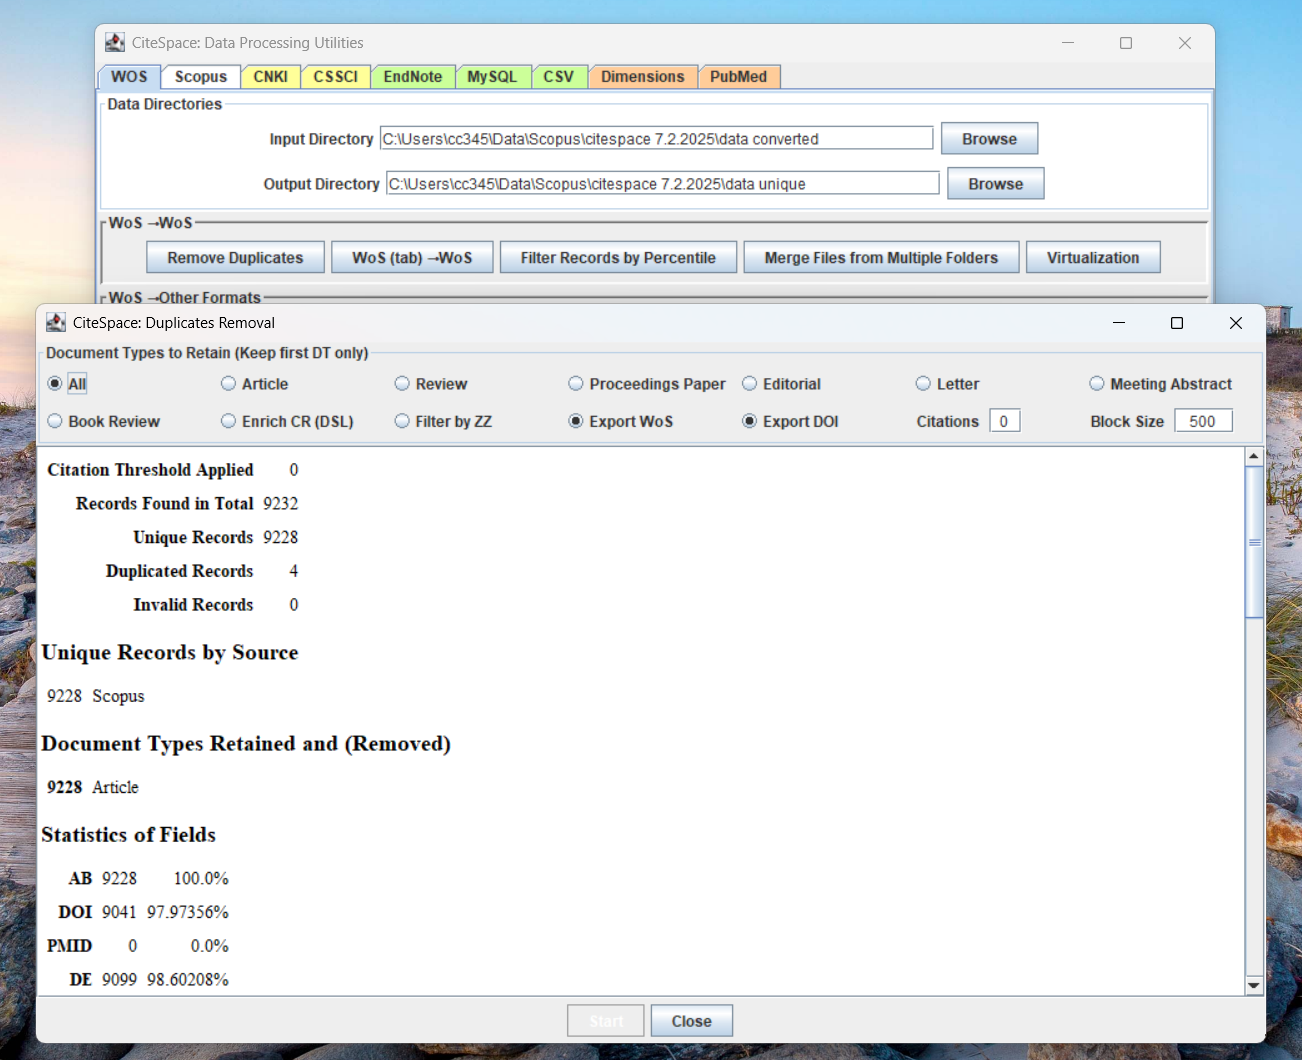
Duplicate Removal
You may wonder why we want to run a duplicate removal function if we already know that our dataset won't contain any duplicates. The Duplicate Removal function does more than duplicate removal. It sorts records by the year of their publication. This simple preprocessing will save you and CiteSpace a lot of time in subsequent analysis.
The Duplicate Removal function will also report additional information that you may need later on. For example, which year is the earliest year with data? To what extent, these records come with DOIs? (97.97% in this case).
Network Visualization
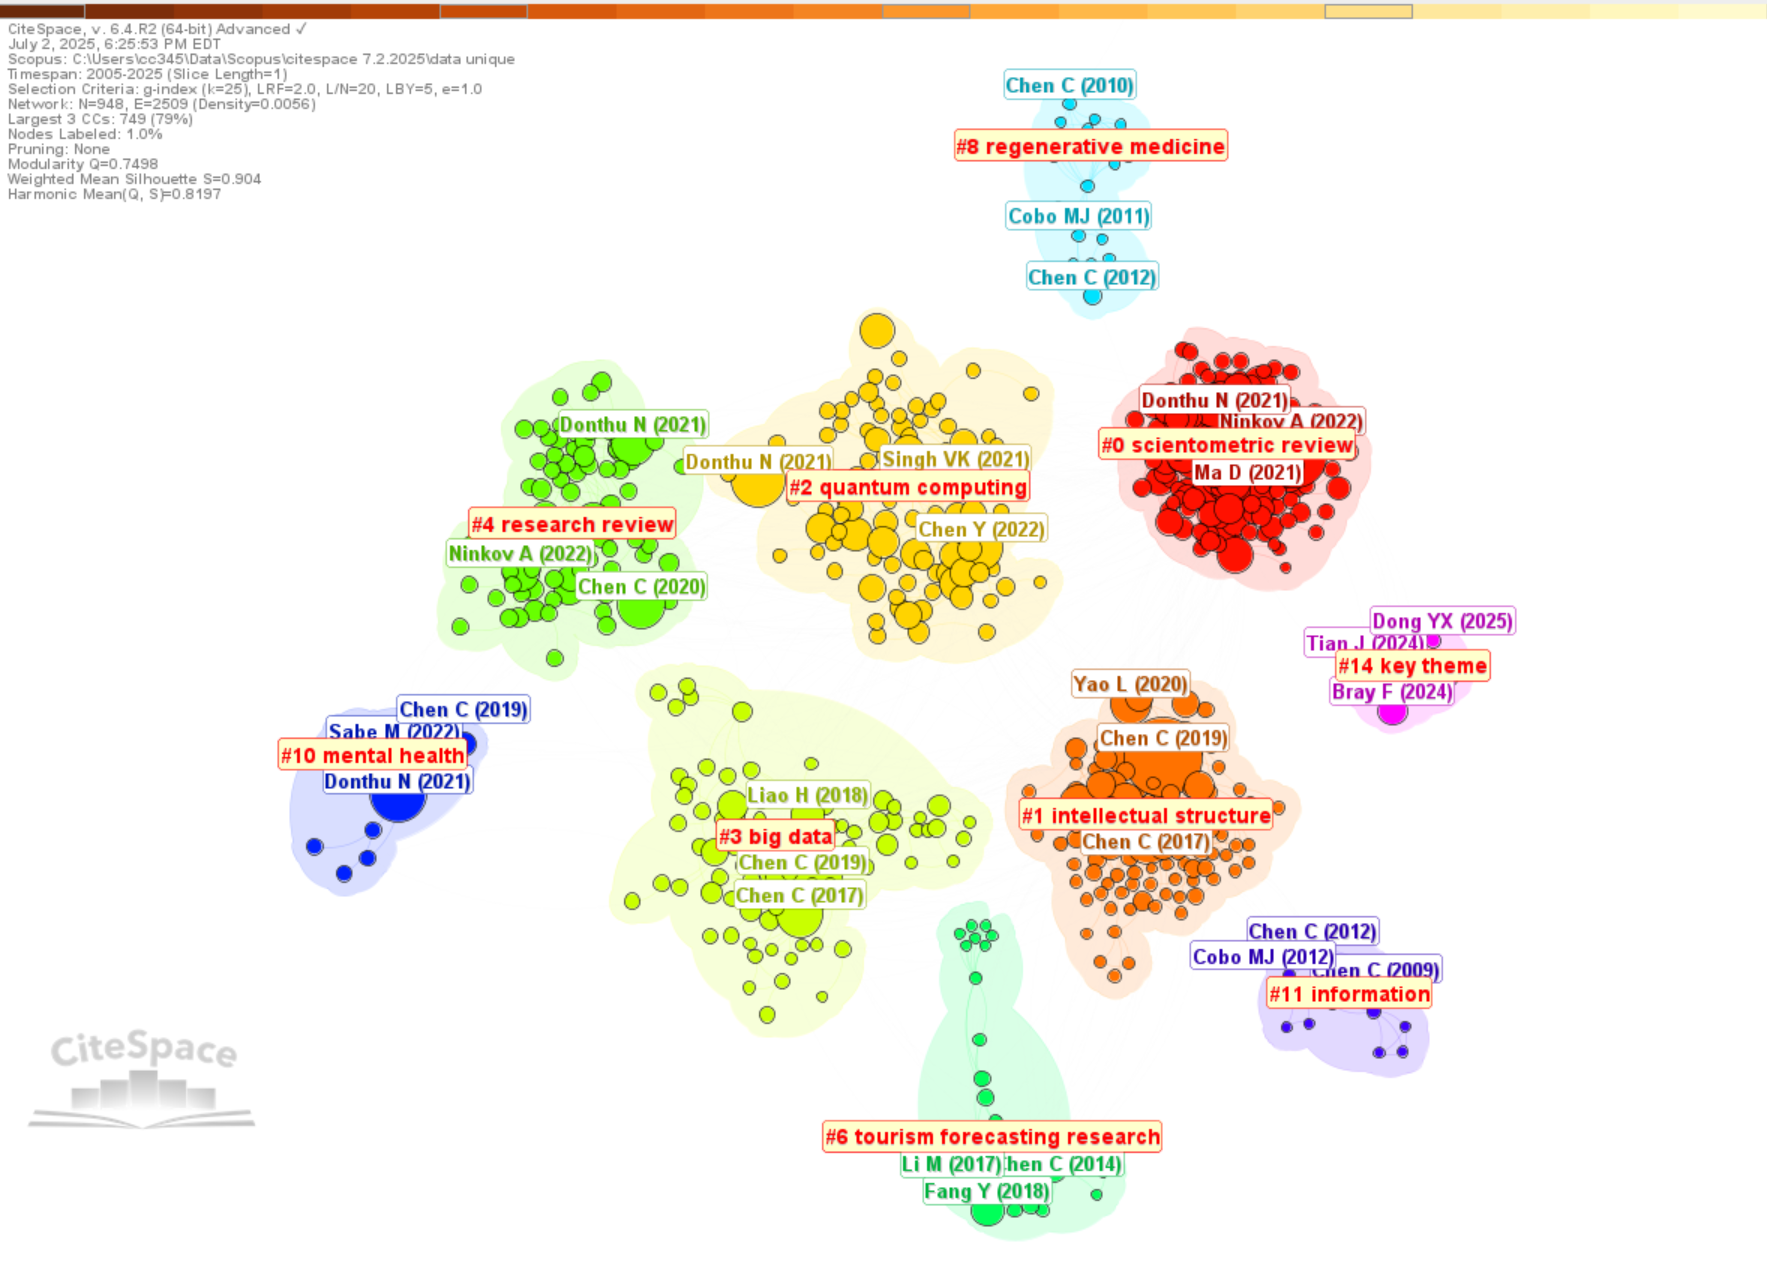
Now you are ready to analyze your dataset with CiteSpace to generate network visualizations, identify clusters, and make sense of the intellectual landscape. When you create a project for this dataset, make sure you select Scopus as the Data Source.
You can analyze such Scopus datasets almost exactly the same way as you would with a dataset from the Web of Science. In terms of the differences, Scopus data contains some extra information, for example, the title of a cited reference, which is not available from the native format of the Web of Science. It becomes possible to generate cluster labels based on the cited references as opposed to the citing articles in default settings. You can explore other possibilities, but you probably want to keep it simple in your initial exploration and focus on the steps demonstrated in this blog and try to generated a network visualization similar to the one below, with cluster labels generated with the All-in-One function.
That's it for now. If you have any questions, feel free to leave your comments.
Updates
The recent user feedback confirmed that directly exporting the search results to the CSV format works fine with CiteSpace 6.4.R2, whereas exporting records from a saved list may lead to a corrupted CSV format.